
 Home
Home News
News
- 1 The MAGIC token formed a double bottom pattern on the chart.
- 2 Buyers have regained momentum and are looking to surpass the 200 day EMA mark.
MAGIC token price rebounded from the bottom zone of $0.4000, forming a double bottom pattern. Moreover, the token is close to breaking out near the 200-day EMA. However, bulls need more support to surpass the crucial barrier of $0.7200. Meanwhile, sellers stayed cautious and tightened their grip. Since the start of 2023, the MAGIC token has been in a downtrend, losing over 70% of gains. MAGIC token fell from the high of $1.50 and is trading below neutrality, showing a volatile chart outlook.
Recently, the MAGIC token showcased a trend reversal and made a higher high after six months of lower lows formation, signaling buying interest. The technicals show the classic W pattern, where investors are making fresh long positions and trying to escape the 200-day EMA.
The live price of the MAGIC token is $0.7048, with an intraday gain of 2.73%, highlighting neutrality. Moreover, the trading volume increased by 26.07% to $48.65 Million, and the pair of MAGIC/BTC is at 0.0000187 BTC. However, the market cap is $32.24 Million.
Will MAGIC Token Surpass Hurdle of $0.7500?
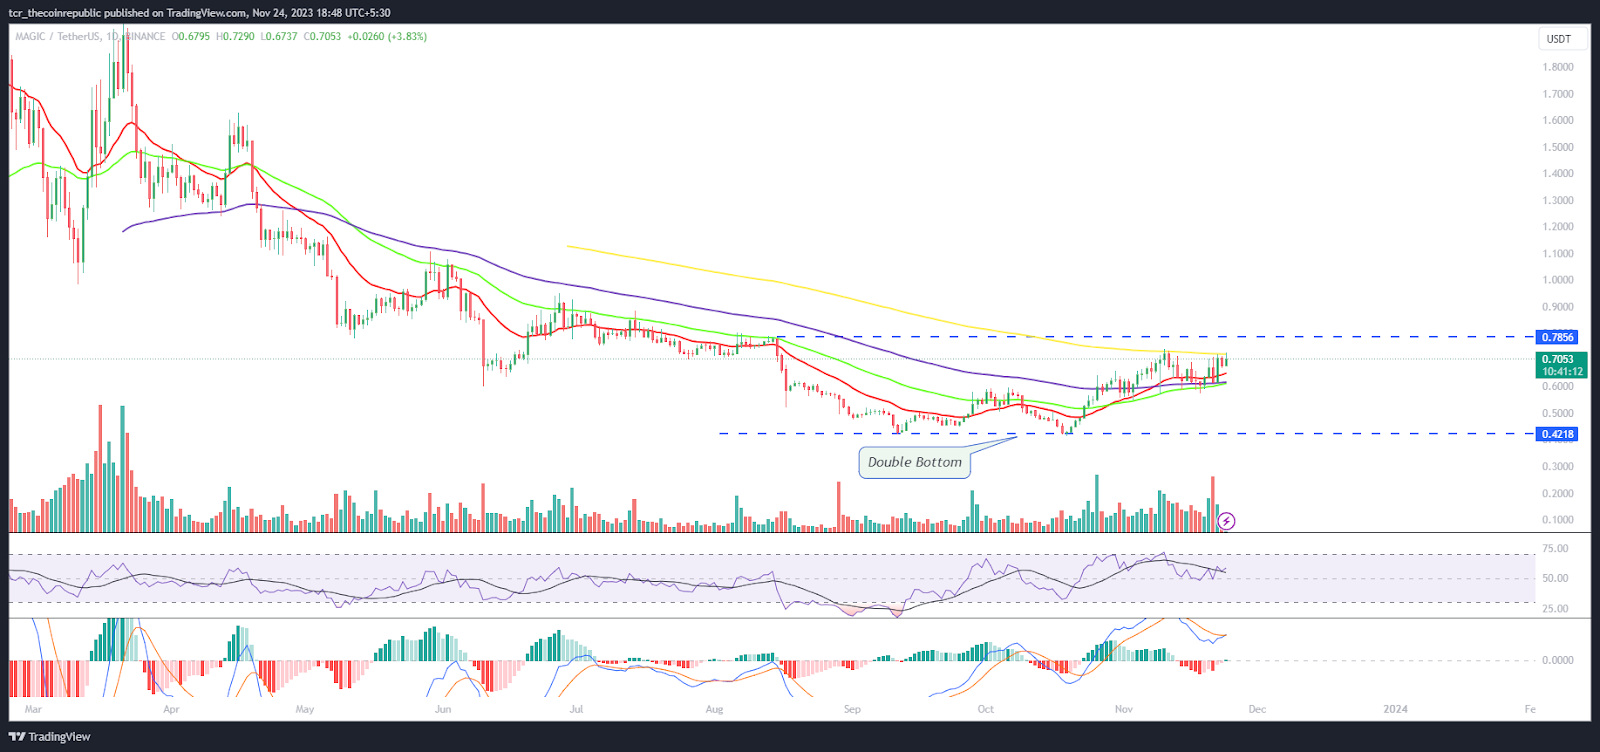
The MAGIC token underwent correction on the daily chart and witnessed the beginning of an uptrend, forming a double bottom pattern near the lows of $0.4000. Additionally, the buying came amid a volume spurt, suggesting that the bulls look confident, and further rallying could be extended if it crosses the 200-day EMA barrier.
The RSI curve is in the overbought zone and formed a positive divergence, suggesting a bullish outlook.The MACD indicator shows a bullish crossover and green bars on the histogram, suggesting the rally will expand soon.
MAGIC Token On Weekly Chart Shows Reversal
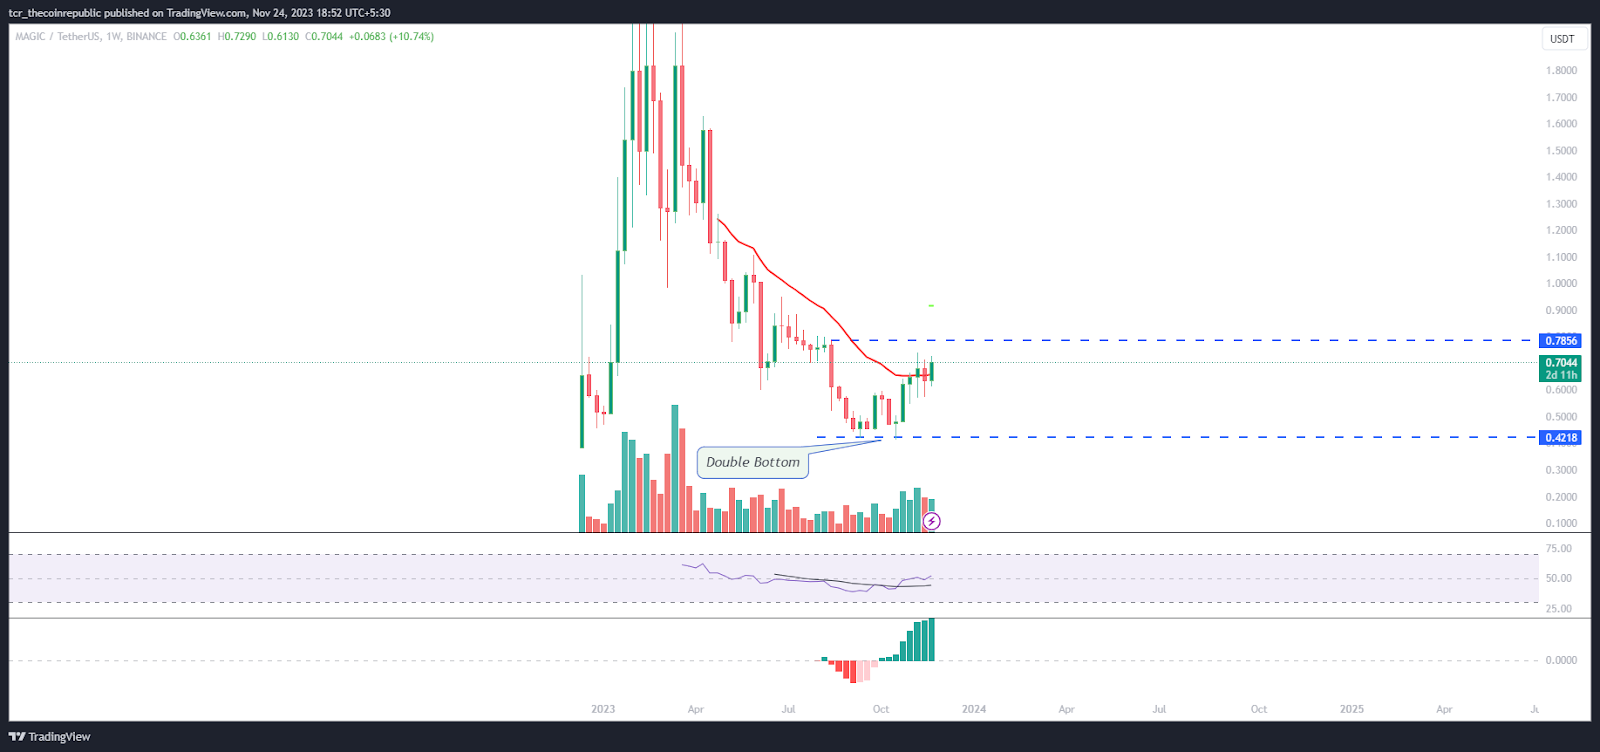
On the weekly chart, MAGIC token formed a hammer candlestick on the bottom, and follow-on buying was witnessed in the past sessions. The price action indicates buyers’ accumulation. The token managed the gains above the 100-day EMA, decisively showcasing the domination of bulls and fresh reversal from the lows. The trend has recently flipped, and further buying moves may soon lift the token price to the swing high of $0.8000.
Summary
The MAGIC token showcases a trend reversal and has initiated a rebound. The token is near a neckline hurdle of $0.7200. If the MAGIC token succeeds in scratching the mark, it will lead to a sharp up-move and may retest the highs of $0.8000.
Technical Levels
Support Levels: $0.6850 and $0.6500
Resistance Levels: $0.7200 and $0.7400
Disclaimer
The views and opinions stated by the author or any other person named in this article are for informational purposes only and do not constitute financial, investment, or other advice. Investing in or trading crypto or stocks comes with a risk of financial loss.

Amanda Shinoy is one of the few women in the space invested knee-deep in crypto. An advocate for increasing the presence of women in crypto, she is known for her accurate technical analysis and price prediction of cryptocurrencies. Readers are often waiting for her opinion about the next rally. She is a finance expert with an MBA in finance. Quitting a corporate job at a leading financial institution, she now engages herself full-time into financial education for the general public.


