
 Home
Home News
News
- 1 FTM token price action shows bullish dominance on the chart.
- 2 FTM price retraced to the 20 day EMA, awaiting a pullback.
Fantom token (FTM) price shows a rebound from the bottom mark of $0.1730 and took flight in recent sessions. FTM token decisively surpassed the hurdles and hit the swing high of $0.3800. A trend reversal was noted because the token is gaining momentum. Amid the rejection from the supply zone of $0.3500, the FTM token did not retrace, and sustained the gains near the 20-day EMA mark. Buyers are attempting a pull back and are halting the gains.
Fantom price is near the resistance mark of $0.3200, as the buyers struggle to surpass the barrier. FTM token paused near the 50% Fibonacci retracement zone and is close to the mid bollinger band. The token has reverted from the bottom mark of $0.1740 and surged over 80% in recent sessions.
The live price of the Fantom token is $0.316, with an intraday gain of 4.62%, showing neutrality on the chart. Moreover, the trading volume increased by 5.44% to $62.46 Million, and the pair of FTM/BTC is at 0.00000820 BTC. However, the market cap of FTM is $62.46 Million. Analysts have maintained a buy rating and suggest a growth outlook for the upcoming sessions.
Will Fantom (FTM) Token Fly Above $0.3500?
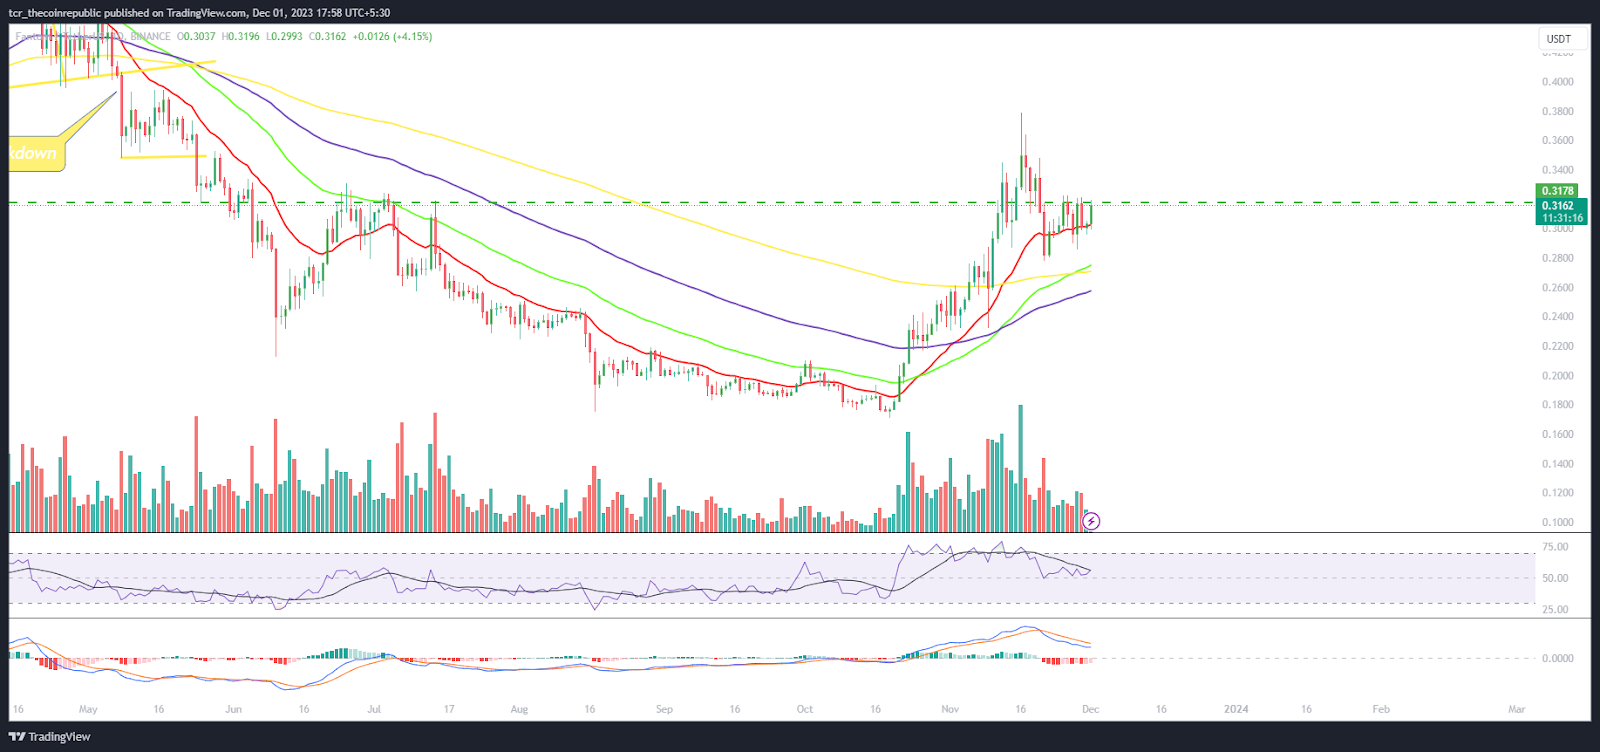
On the daily chart, the Fantom (FTM) token price has shown a vertical rebound from the bottom mark of $0.1700 and shows a bullish outlook in recent sessions. The token has absorbed the selloff, replicates the trend reversal, and surpassed the key MA. Moreover, the FTM token retested neutrality and is waiting for a significant bounce to escape the near-term hurdle of $0.3500.
The RSI curve stayed in the overbought zone and formed a negative divergence on the chart, replicating the volatile outlook. The MACD shows a bearish crossover and red bars on the histogram, suggesting a profit booking outlook.
Weekly Charts Shows Rejection From 100 Day EMA?
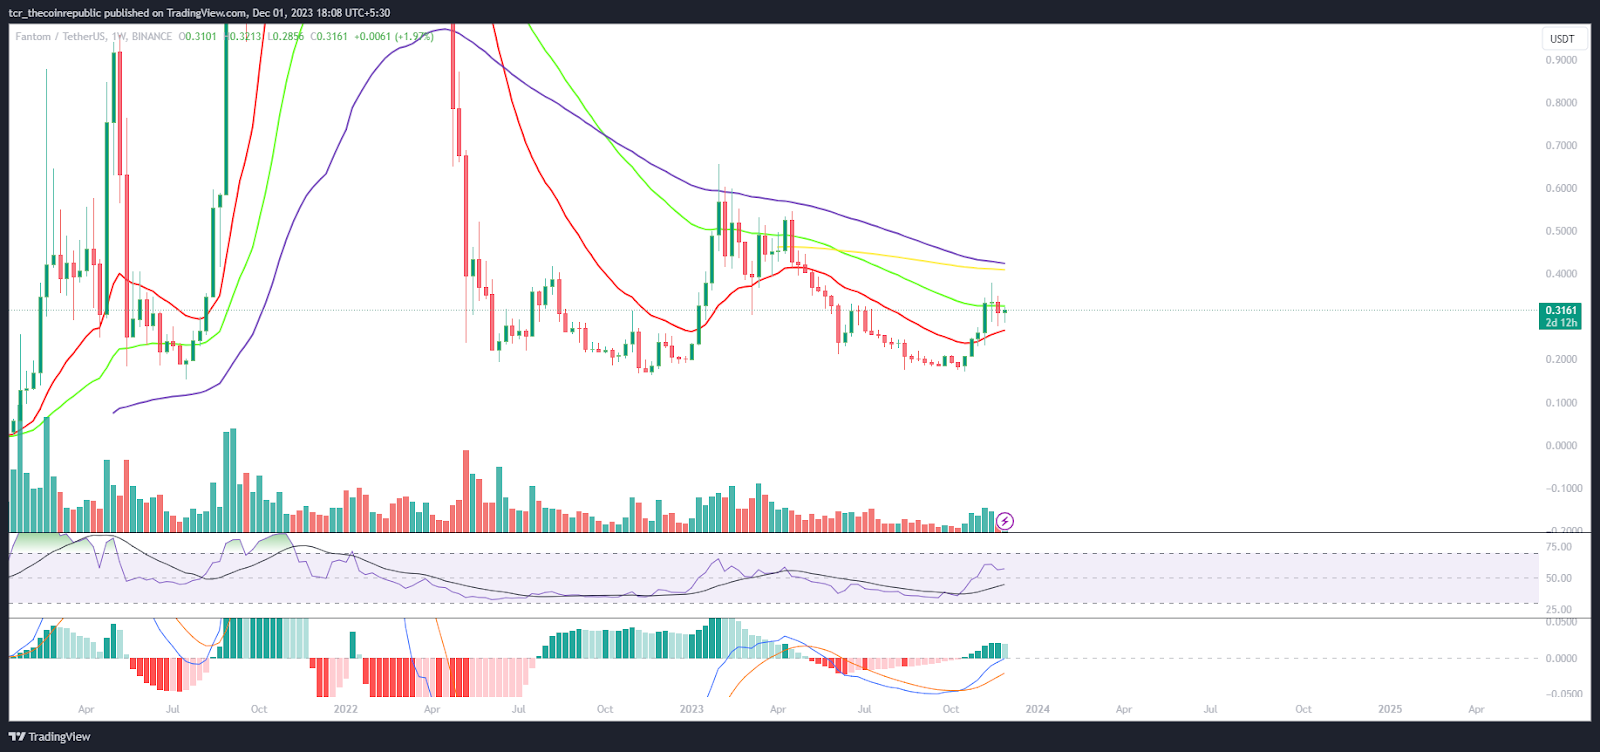
The FTM token price shows a double bottom pattern on the weekly chart, and buyers face barriers near the 100-day EMA. However, the buyers look aggressive and are trying their best to surpass the neckline of $0.4000.
Summary
Fantom token (FTM) price reached the supply zone of $0.3500, as the buyers are dominating the battle. The price action highlights a bullish outlook and suggests that FTM will reach the prompt hurdle of $0.4000.
Technical Levels
Support Levels: $6.60 and $6.00
Resistance Levels: $7.10 and $7.50
Disclaimer
The views and opinions stated by the author or any other person named in this article are for informational purposes only and do not constitute financial, investment, or other advice. Investing in or trading crypto or stocks comes with a risk of financial loss.

Steefan George is a crypto and blockchain enthusiast, with a remarkable grasp on market and technology. Having a graduate degree in computer science and an MBA in BFSI, he is an excellent technology writer at The Coin Republic. He is passionate about getting a billion of the human population onto Web3. His principle is to write like “explaining to a 6-year old”, so that a layman can learn the potential of, and get benefitted from this revolutionary technology.


