
 Home
Home News
News
- 1 VET crypto price showed a massive upside this month.
- 2 Buyers have gained momentum and are willing to escape $0.2300.
Vechain price retested the neckline hurdle of $0.2300, revamped from the lows of $0.1460 post a snappy recovery. The price action indicates the short squeeze, and buyers persist in accumulating the token and continue to extend the gains. Vechain formed a double bottom formation and escaped the neckline of $0.2000, registering a breakout.
VET price surpassed the notable moving averages and approached the bullish trajectory mark above $0.2000. The technicals are suggesting that the VET token has done its correction and is showing a trend reversal. Recently, the VET price retraced from the supply zone of $0.2300 and retested the 200-day EMA, but a sharp pullback was witnessed.
The live price of the Vechain (VET) token is $0.2267, with an intraday gain of 3.40%, showing bullishness on the charts. Moreover, the trading volume increased by 2.44% to $42 Million. However, the pair of VET/BTC is at 0.00000589 BTC, and the market cap of VET is $1.53 Billion. Analysts have maintained a buy rating and suggest that VET crypto may continue to spray the gains in the following sessions.
VET Price Overtakes $0.2000 on Daily Chart
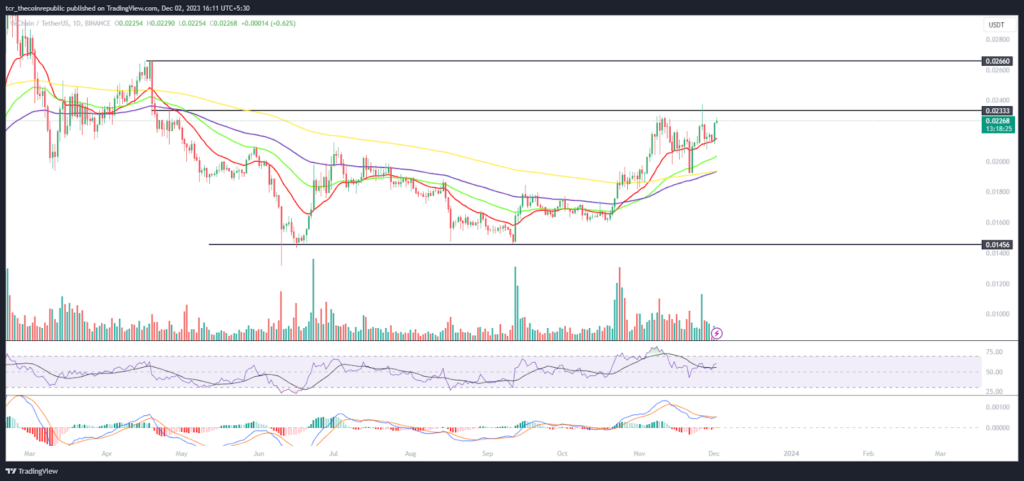
On the daily chart, VET price was in a downtrend and made a base near $0.1400, where a double-bottom formation was witnessed. Afterwards, sellers did not extend the fall, and a smart recovery was noted. Vechain price surged over 51% this month and replicated investors’ interest on the charts.
The RSI curve stayed in the overbought zone and formed a positive divergence, suggesting a potential to reach the swing high of $0.2500 soon.
The MACD indicator showed a bearish crossover and formed red bars on the histogram, suggesting a volatile outlook on the charts.
Weekly Charts Reveals Trendline Breakout
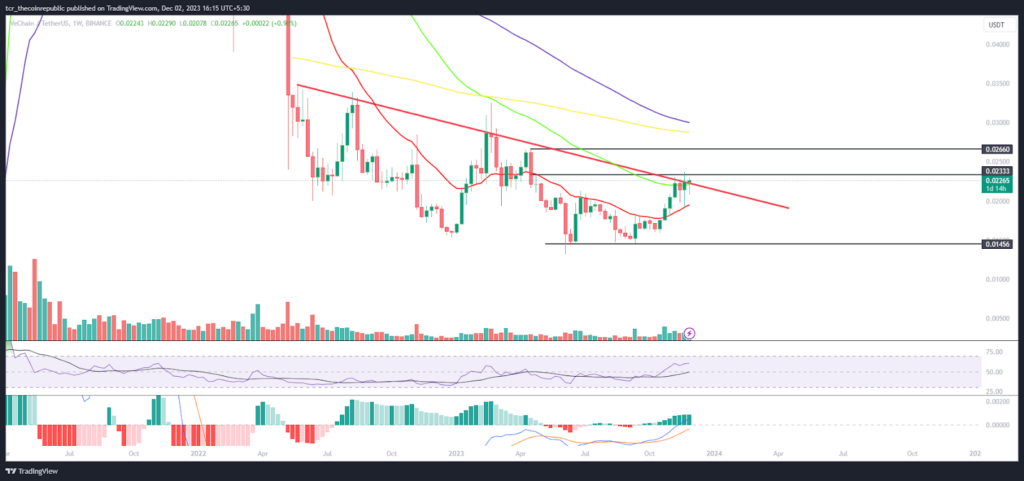
On the weekly chart, the VET token price showcased a trendline breakout but faced the 50-day EMA resistance to spread the rally. Meanwhile, a hammer candlestick was formed during the recovery, and further continuation of bullishness is anticipated per the technicals.
Summary
Vechain price showcased a trend reversal from the bottom zone of $0.1400 and decisively recovered the gains following the crypto market pump. Buyers captured the momentum and persisted in accumulating the token, resulting in a short covering move that trapped sellers. Indicators are giving mixed signals – RSI shows a positive divergence while the MACD shows a bearish crossover.
Technical Levels
Support Levels: $0.2100 and $0.1800
Resistance Levels: $0.2400 and $0.2600
Disclaimer
The views and opinions stated by the author or any other person named in this article are for informational purposes only and do not constitute financial, investment, or other advice. Investing in or trading crypto or stocks comes with a risk of financial loss.

With a background in journalism, Ritika Sharma has worked with many reputed media firms focusing on general news such as politics and crime. She joined The Coin Republic as a reporter for crypto, and found a great passion for cryptocurrency, Web3, NFTs and other digital assets. She spends a lot of time researching and delving deeper into these concepts around the clock, and is a strong advocate for women in STEM.


