
 Home
Home News
News
- 1 ETC price is on its way to exceed the prompt hurdle of $20.
- 2 Buyers have regained strength and are gaining momentum.
ETC price was revamped from the support zone of $15, and a range breakout was noted on the chart. Moreover, the ETC coin has approached the neutral region and is heading to surpass the immediate hurdle of $20. Meanwhile, the battle is at an exciting stage, where if buyers succeed in escaping the mark of $20, there will be a sharp spike and ETC price may reach $25 soon. Conversely, if ETC fails to sustain above the 20-day EMA mark, it will slip to the support zone of $17.
ETC coin has attained momentum post the range breakout and is favoring the bulls. The price action highlights the buyers’ accumulation, and that ETC coin is heading towards the make-or-break zone of $20, which is a strong challenge for the bulls. The technicals suggest that the ETC coin is crossing the trendline, and that bulls are trying their best to top the barrier.
The live price of the ETC coin is $19.71, with an intraday gain of 2.88%, showing a reversal on the charts. Moreover, the trading volume increased by 8.79% to $244.85 Million. However, the pair of ETC/BTC is at 0.000505 BTC, and the market cap is $2.88 Billion. Analysts have maintained a buy rating and suggest a growth outlook for the upcoming sessions.
ETC Price Near Make or Break Zone of $20
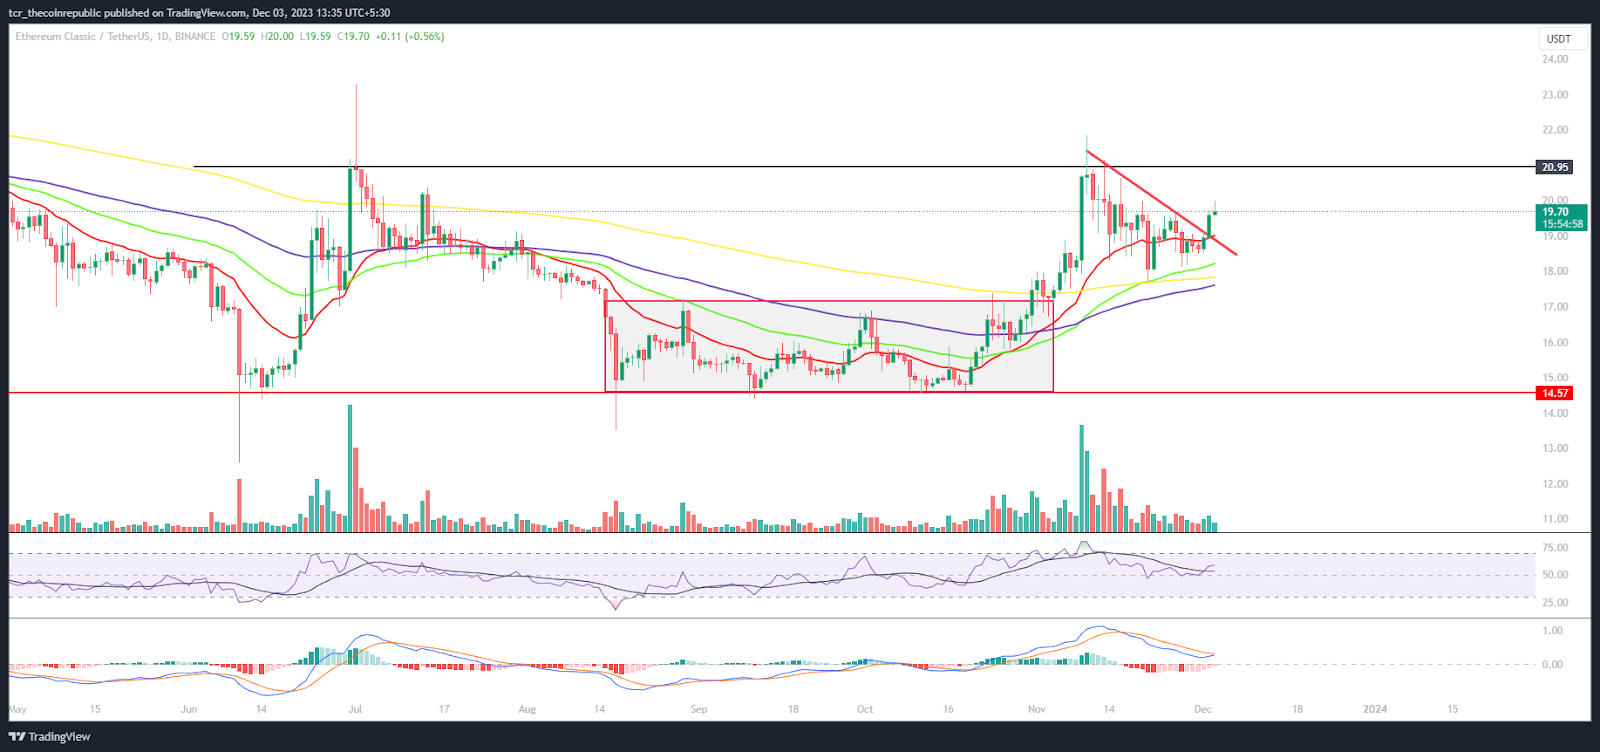
On the daily chart, the ETC coin was in a downtrend and retraced from the swing high of $20 in the last few months. Since then, ETC has been consolidating in a narrow range.
The RSI curve stayed in the overbought zone and formed a positive divergence, replicating an impressive chart outlook.
The MACD indicator showed convergence of the MA line with the signal line signals that red bars have ended, and fresh buying momentum was witnessed on the charts.
Weekly Charts Shows Roller Coaster Moves
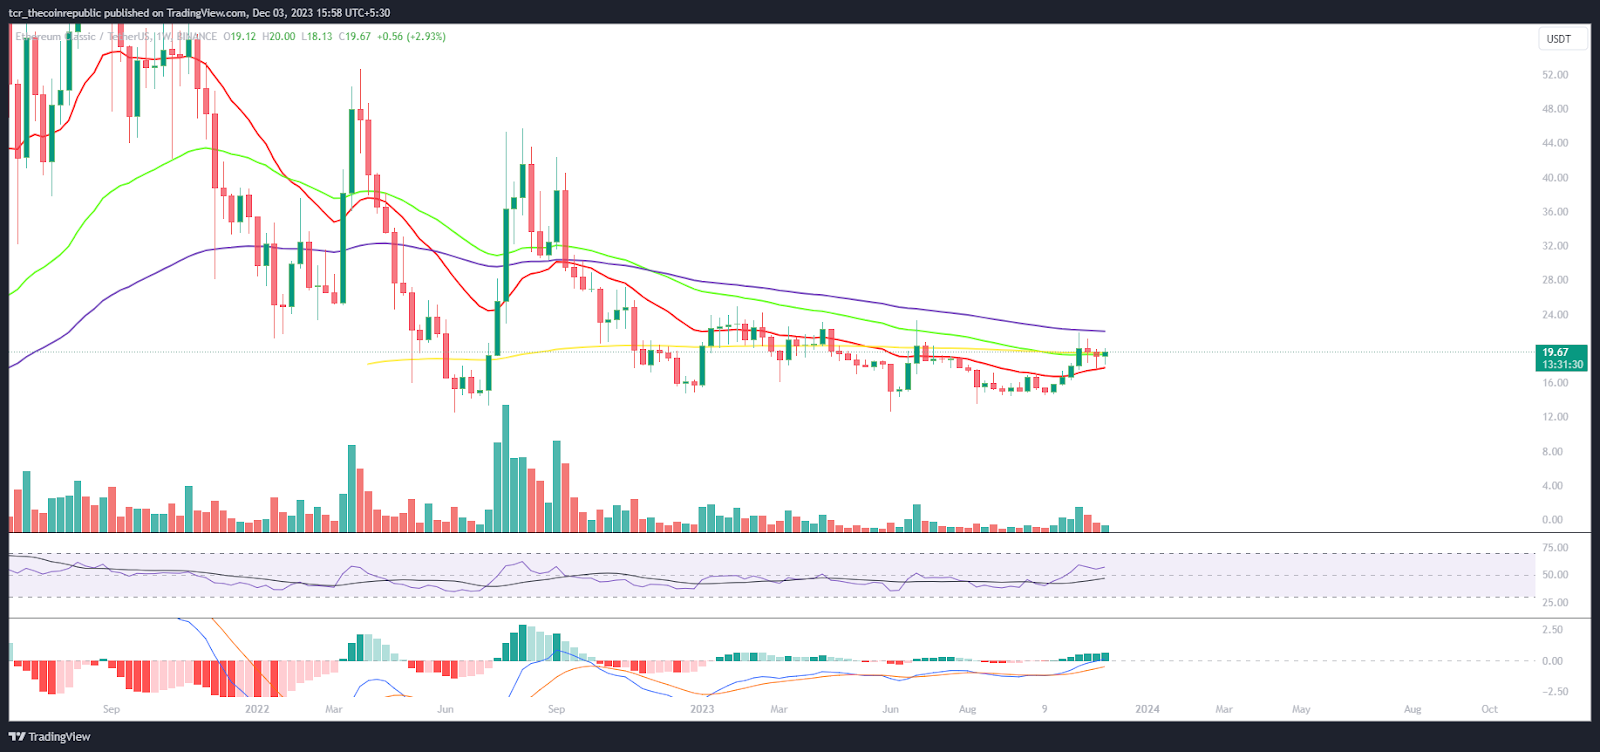
On the weekly chart, the ETC price was sailing in a narrow range and struggled with the 50-day EMA barrier over the past weeks, which acted as a strong hurdle. Buyers persisted in escaping but faced rejection and hovered below $20.
Summary
ETC coin price shows a rebound and is close to the make-or-break zone of $20, where the 100-day EMA acted as a prompt hurdle. Beyond the mark, the buying momentum was extended, and a bullish rally is anticipated toward the $25 mark, followed by $28 on a short-term basis.
Technical Levels
Support Levels: $17 and $15
Resistance Levels: $20 and $22
Disclaimer
The views and opinions stated by the author or any other person named in this article are for informational purposes only and do not constitute financial, investment, or other advice. Investing in or trading crypto or stocks comes with a risk of financial loss.

Andrew is a blockchain developer who developed his interest in cryptocurrencies while pursuing his post-graduation major in blockchain development. He is a keen observer of details and shares his passion for writing, along with coding. His backend knowledge about blockchain helps him give a unique perspective to his writing skills, and a reliable craft at explaining the concepts such as blockchain programming, languages and token minting. He also frequently shares technical details and performance indicators of ICOs and IDOs.


