
 Home
Home News
News
- 1 ETC price witnessed a reversal from the 200 day EMA mark.
- 2 Buyers are willing to extend the rally beyond the prompt hurdle of $23.
ETC price witnessed a trendline breakout and rebounded from the low of $15 in a bullish spell. Moreover, as ETC price enters a bullish trajectory, it is clearly heading for the supply zone of $23. The ETC price has recently pulled back and hit $20; afterward, a retracement was witnessed. However, during the retracement, the ETC price retested the 200-day EMA mark and a sharp bounce trapped the sellers.
ETC price has surpassed the key moving averages and has registered a range breakout above $20. Furthermore, the price action signifies the buyers’ accumulation, and that the bulls are setting their eyes on the immediate hurdle of $23, followed by $25. The technicals display the bulls’ dominance and signal a similar performance for the coming sessions. ETC price has sustained the gains above the 50% Fibonacci retracement zone and has climbed beyond the mid-bollinger band.
The live price of ETC crypto is $21.97, with an intraday gain of 4.97%, showing bullishness on the chart. Moreover, the trading volume increased by 18.76% to $496.94 Million, which signifies the investors’ interest. However, the pair of ETC/BTC is at 0.000520 BTC, and the market cap is $3.24 Billion. Analysts have maintained a bullish rating for the coming sessions.
ETC Price Displays Trendline Breakout on Daily Chart
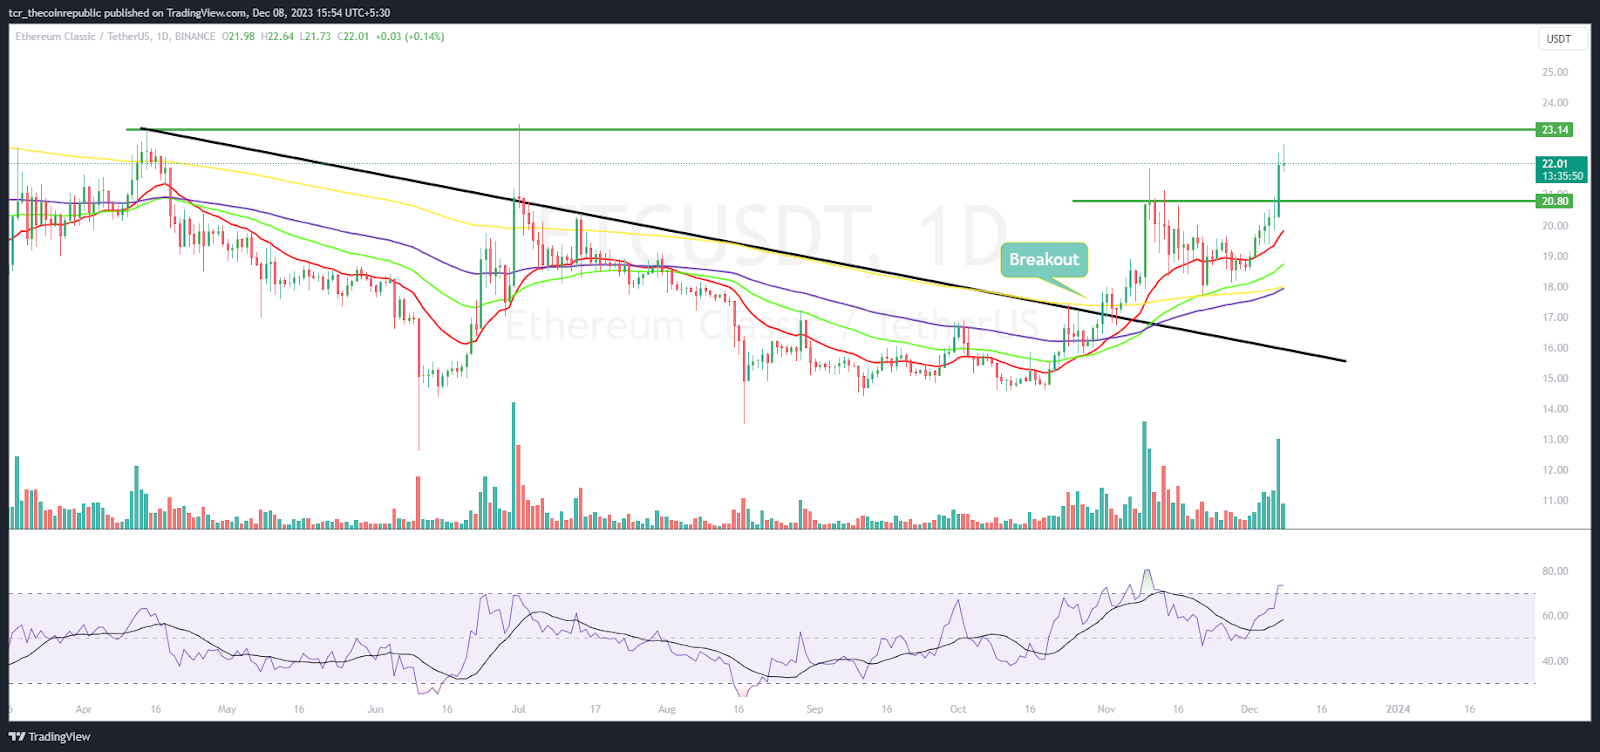
On the daily chart, the ETC price shows a vertical spike from the lows of $15 and surged over 35% in the recent sessions. Furthermore, the technicals delivered bullish momentum, and the ETC crypto price approached the bullish territory, performing impressively in the past few trading sessions.
The RSI curve stayed in the overbought zone near 70, signaling an uptrend and suggesting that the ETC price will reach $25 soon. The MACD indicator shows a bullish crossover and formed green bars on the histogram, suggesting an optimistic view for the following sessions.
ETC on Weekly Chart Claimed the 100 Day EMA Mark
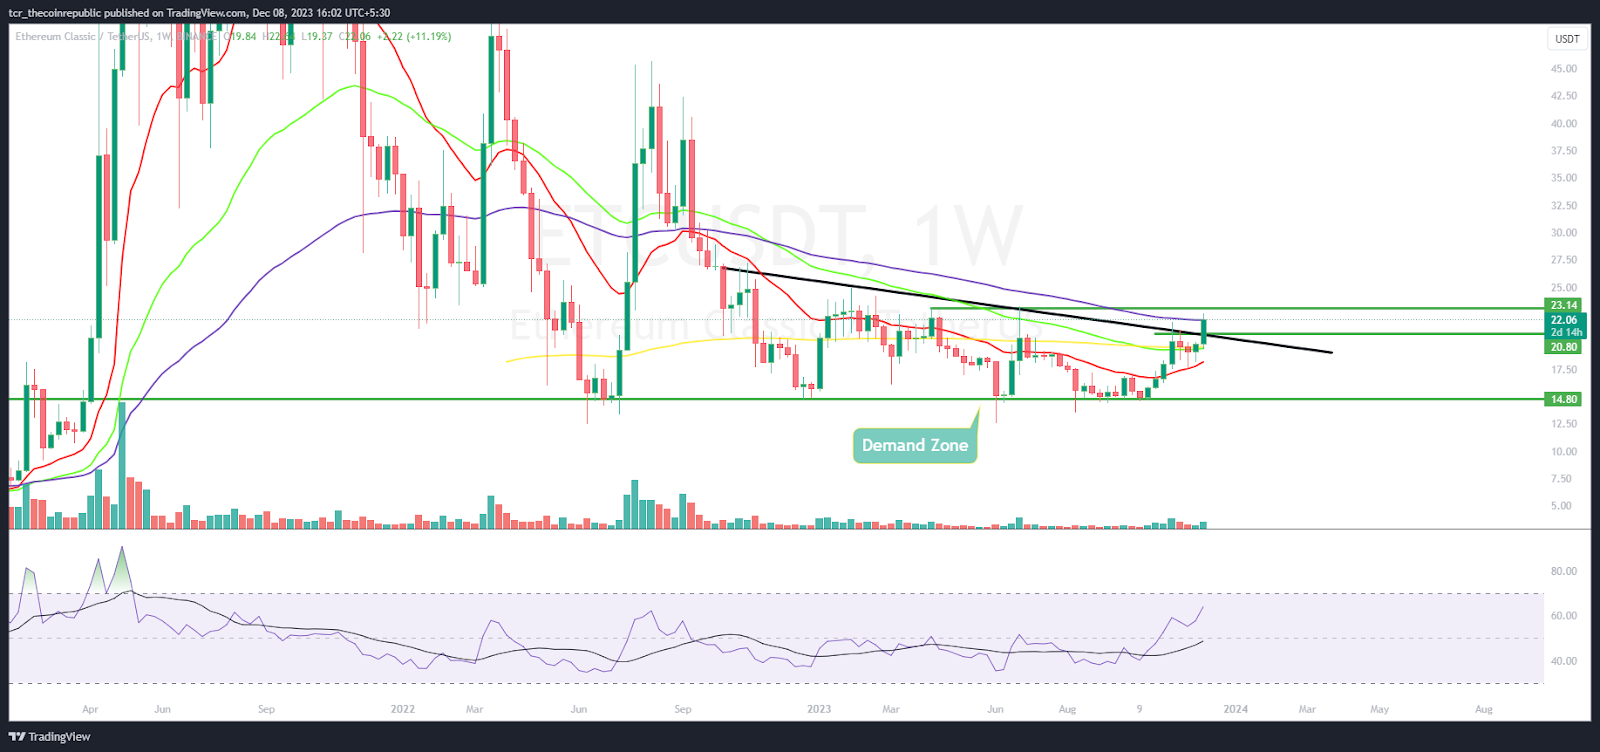
On the weekly chart, ETC price rebounded from the demand zone and is close to the 100-day EMA, where bulls are trying to surpass the range and are looking to reach the blue sky zone above $25. Furthermore, the ETC crypto depicts a trend reversal, and a fresh higher high swing was formed above $20, demonstrating the bullish path for the following sessions.
Summary
ETC price surpassed the critical hurdle of $20 and witnessed a range breakout in the recent sessions. Moreover, the price action reveals the buying momentum. The bulls are looking aggressive and continue to accumulate ETC crypto.
Technical Levels
Support Levels: $18 and $15
Resistance Levels: $23 and $25
Disclaimer
The views and opinions stated by the author or any other person named in this article are for informational purposes only and do not constitute financial, investment, or other advice. Investing in or trading crypto or stocks comes with a risk of financial loss.

With a background in journalism, Ritika Sharma has worked with many reputed media firms focusing on general news such as politics and crime. She joined The Coin Republic as a reporter for crypto, and found a great passion for cryptocurrency, Web3, NFTs and other digital assets. She spends a lot of time researching and delving deeper into these concepts around the clock, and is a strong advocate for women in STEM.


