
 Home
Home News
News
- 1 Lido dao is trading above the key moving averages, sustaining bullishness.
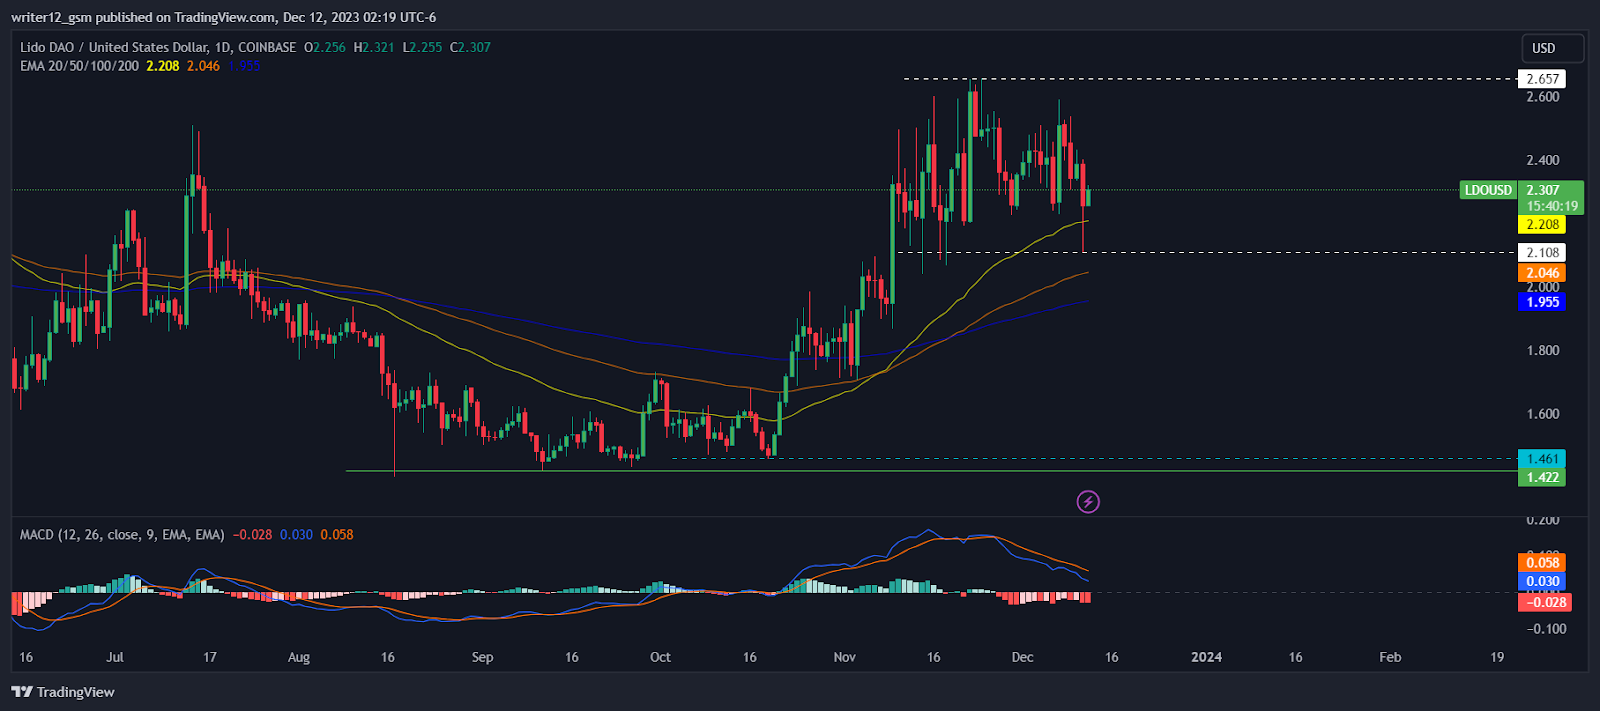
- 2 LDO halted near the $2.657 mark and is currently taking support on the 200 EMA level.
Lido Dao (LDO) price is gaining momentum and broke trading the 20, 50, 100, and 200-day EMAs, indicating bullishness in the previous trading sessions. The chart also shows that the price is taking support from the 200 Day EMA levels indicating buyers’ presence.
The crypto has repeatedly touched the demand area around $2.108 and bounced back with support. Buyers have gained momentum and are targeting the $2.657 level in the upcoming sessions.
The chart pattern reveals a turbulent movement in the past months, with the crypto facing many rejections from the supply zone of $2.600. The higher levels near $2.108 served as a support area, and the crypto rebounded from there, making the price move in a tight range.
Moreover, the crypto’s path shows that above $2.700, the zone is bullish, and a surge could happen. But, if more rejection occurs, then the crypto will keep trading in the congestion zone. Likewise, below $2.100, bearishness could increase.
At the time of writing, Lido Dao crypto was trading at $2.315 with a daily gain of 2.57% breaking below the 200-day EMA, showing bullishness on the charts. Furthermore, the daily trading volume is 100.684 Million The market cap of Lido Dao crypto is $2.032 Billion.
Technical Analysis of Lido Dao
The Lido Dao crypto (USD: LDO) is trading over the 50 and 200-day exponential moving averages (EMAs), which is a positive sign. But, if more buyers join in, then the price could back the bullish trend by making higher peaks and new peaks. So, the Lido Dao price is likely to go up giving bullish outlooks over the daily time frame chart.
The RSI value is 48.98 points. The 14 SMA is near the middle line at 53.22 points which shows that the Lido Dao crypto is balanced.
The MACD line at 0.030 and the signal line at 0.058 are over the zero line. A bearish crossover is seen in the MACD indicator which indicates a loss of strength in the LDO crypto price momentum.
Short-Time Horizon Analysis
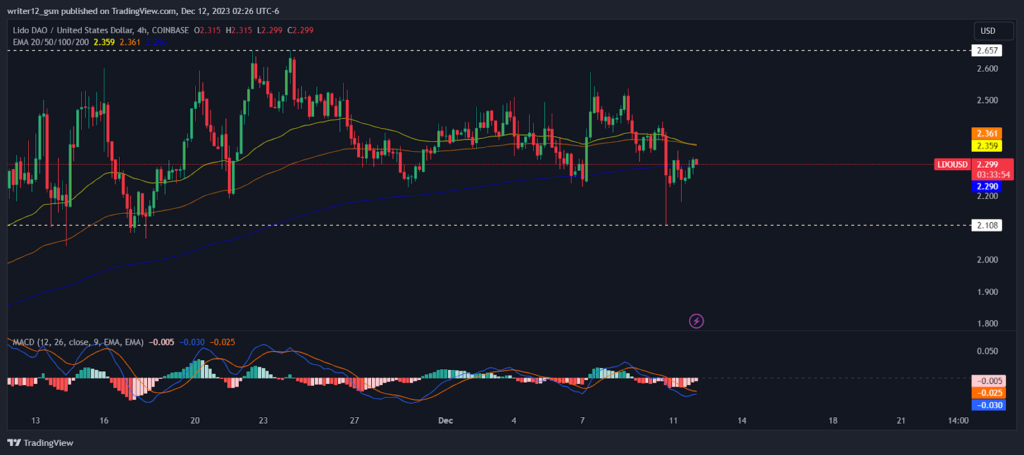
Lido Dao crypto has displayed sellers’ power, and profit-taking in the crypto was observed on the short-term charts. Also, the price moved below the key EMAs, which indicates more decline in the crypto. The RSI curve is close to the oversold area at 46, implying bearishness on the chart. The MACD indicator continued to form red bars, and a bearish crossover was seen, which suggests corrective actions.
Summary
Lido Dao (LDO) is showing signs of bullishness as it is above the key moving averages and the 200-day EMA support level. The crypto has the potential to break out of the supply zone of $2.600 and reach the $2.700 level if the buying volume increases. However, the crypto faces the risk of falling below the demand zone of $2.100 and losing momentum if the selling pressure mounts. The RSI and MACD indicators are neutral to bearish, suggesting that traders need to be cautious.
Technical Levels
Support Level: $2.108.
Resistance Level: $2.657.
Disclaimer
This article is for informational purposes only and does not provide any financial, investment, or other advice. The author or any people mentioned in this article are not responsible for any financial loss that may occur from investing in or trading. Please do your own research before making any financial decisions

Adarsh Singh is a true connoisseur of Defi and Blockchain technologies, who left his job at a “Big 4” multinational finance firm to pursue crypto and NFT trading full-time. He has a strong background in finance, with MBA from a prestigious B-school. He delves deep into these innovative fields, unraveling their intricacies. Uncovering hidden gems, be it coins, tokens or NFTs, is his expertise. NFTs drive deep interest for him, and his creative analysis of NFTs opens up engaging narratives. He strives to bring decentralized digital assets accessible to the masses.


