
 Home
Home News
News
- 1 Arbitrum crypto price is currently trading above the key moving averages, showcasing bullishness.
- 2 At press time, ARB had a market cap of $1.436 Billion.
The Arbitrum cryptocurrency price shows a bullish chart structure and is trading above key moving averages, showing the buyers’ dominance in past trading sessions. Moreover, the chart structure favors the buyers and suggests follow-up buying that will lead to $1.3003 in the next session.
ARB crypto price is trading above neutral levels and has shown buying momentum in recent sessions. The ARB cryptocurrency has shown an optimistic outlook and continues to overcome obstacles resolutely. It is expected to break out of the $1.3003 range.

At the time of publishing, the price of the ARB cryptocurrency plunged by 9.56% intraday and was trading at $1.1317, highlighting the bullishness on the chart. Moreover, the trading volume is $894.535 Million and the market capitalization is $1.435 Billion.
How Arbitrum Crypto Price is Performing on the 1-D Time Frame: A Technical Analysis
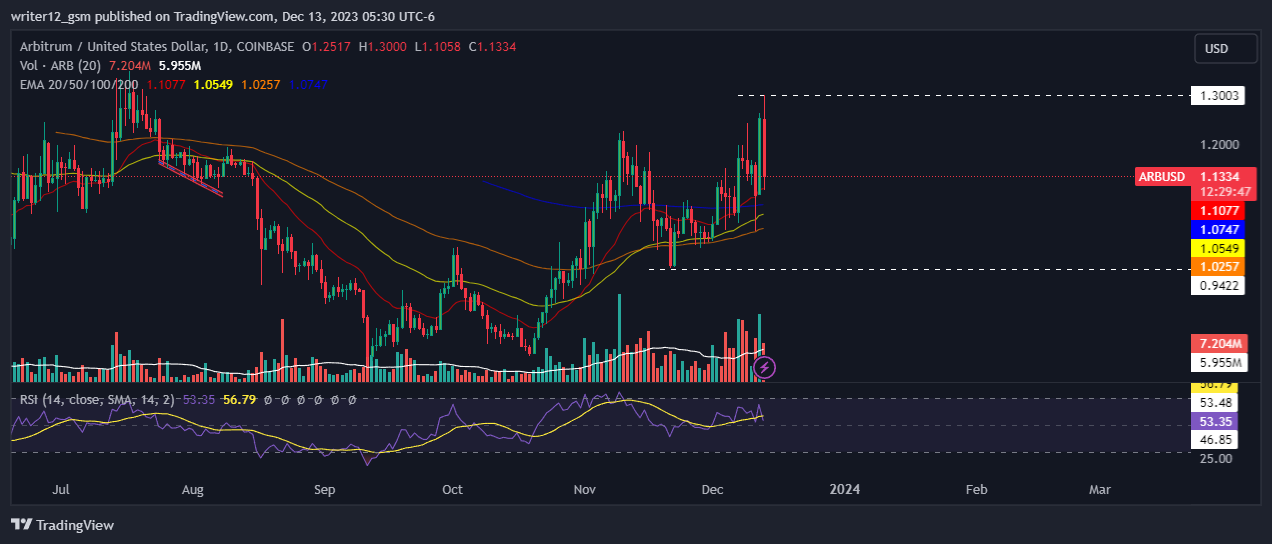
The Arbitrum (USD: ARB) cryptocurrency is currently trading above its 50-day and 200-day EMAs.
The current RSI value is 53.19 points. The 14 SMA is above the center line at 56.78 points, highlighting the bullish nature of the Arbitrum cryptocurrency. The MACD line at 0.0343 and the signal line at 0.0264 are above the zero line. A bullish crossover is observed in the MACD indicator, which indicates strength in the price of the ARB cryptocurrency.
What the Weekly Timeframe Tells About ARB Crypto
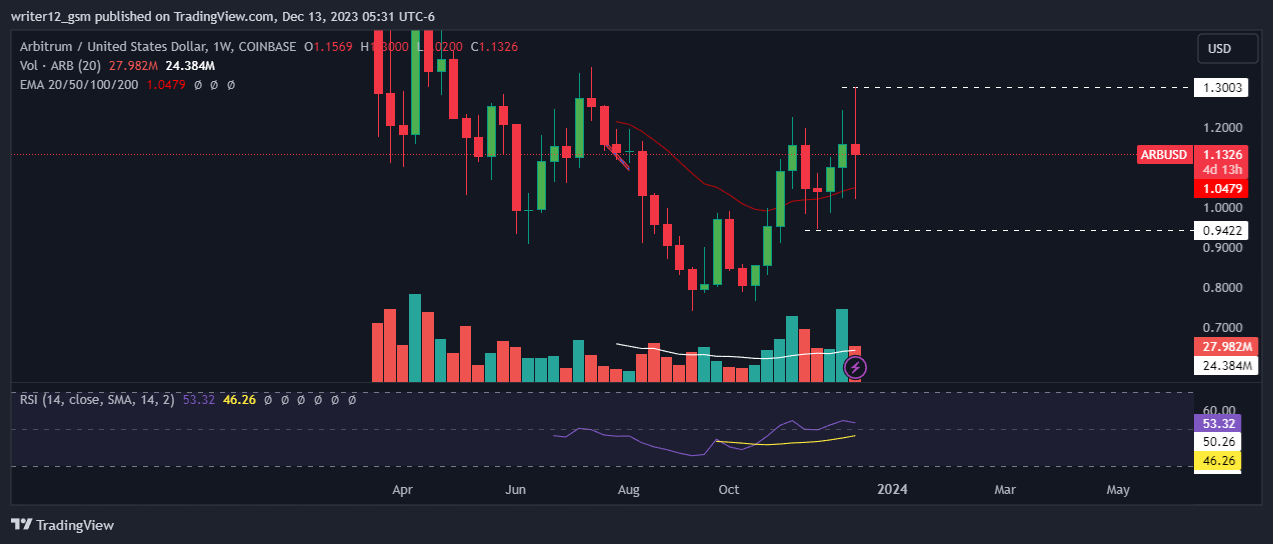
During the week, the price of the Arbitrum cryptocurrency is showing strong bullish momentum, forming a higher structure and trading above the key moving averages.
The current RSI value is at 53.35 points, which is close to the overbought level. The 14 SMA is above the center line at 46.26 points, highlighting the bullish nature of the Arbitrum cryptocurrency.
The MACD line at -0.0202 and the signal line at -0.662 are below the zero line but rising high. There is a bearish crossover in the MACD indicator, which indicates weak momentum in the price of the ARB cryptocurrency.
Summary
Price movements reflect the current favorable outlook. Nevertheless, investors and traders must prepare for the next step. The MACD, RSI, and EMAs are giving positive signs, implying that the ARB cryptocurrency price may continue to rise. However, as buying volume rises, the price is expected to mark new highs to maintain the bullish momentum. Meanwhile, the Arbitrum price is expected to move higher, giving a bullish viewpoint on the daily chart.
Technical Levels
Support Levels: $1.0747 and $0.9422
Resistance Levels $1.3003 and $1.4000
Disclaimer
The analysis provided in this article is for informational and educational purposes only. Do not rely on this information as financial, investment, or trading advice. Investing and trading in crypto involves risk. Please assess your situation and risk tolerance before making any investment decisions.

Andrew is a blockchain developer who developed his interest in cryptocurrencies while pursuing his post-graduation major in blockchain development. He is a keen observer of details and shares his passion for writing, along with coding. His backend knowledge about blockchain helps him give a unique perspective to his writing skills, and a reliable craft at explaining the concepts such as blockchain programming, languages and token minting. He also frequently shares technical details and performance indicators of ICOs and IDOs.


