


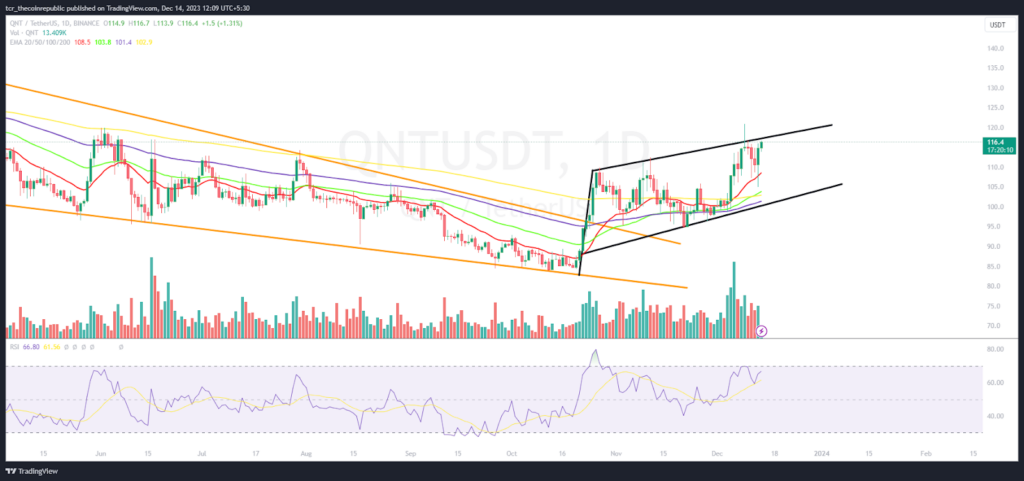
The QNT price has attained a bullish momentum and replicates a golden crossover, which led to a sharp upward move on the charts. Buyers have attained strength and are gaining traction, setting eyesight to claim the round mark of $150. Recently, the QNT token price has faced rejection from the hurdle of $120 and is pausing the gains now. However, the buyers are holding the gains and have rebounded from the psychological mark of $100 in the past few trading sessions.
The QNT price has surpassed the key moving averages and is trading in a bullish trajectory, displaying the uptrend on the charts. Moreover, the QNT crypto price is close to the breakout region of $120. If bulls succeed in escaping the hurdle, the token price will skyrocket. It may reach the swing high of $130 followed by $140 in the following sessions.
The live price of the QNT crypto is $116.16 with an intraday gain of 8.75%, showing bullishness on the charts. Moreover, the trading volume increased by 4.32% to $34.27 Million. However, the pair of QNT/BTC is at 0.00270 BTC and the market cap is $1.14 Billion. Analysts have maintained a buy rating and suggest a positive sentimental view for the following sessions.
QNT on Daily Charts Witnessed Bullish Flag Pattern
2
On the daily charts, the QNT token price showed a bullish flag pattern and buyers have persisted in uplifting the gains for the past sessions. Furthermore, the price action shows the trend reversal and has surpassed the key moving averages, replacing outperformance. Per the technicals, the token price has persisted in extending the gains and is close to the barrier of $120.
The RSI curve stayed near 65 above the neutral region and is forming a positive divergence on the charts. The MACD indicator showed a bullish crossover and formed green bars on the charts, replicating the bulls’ dominance.
QNT on Weekly Charts Displays Falling Wedge Breakout
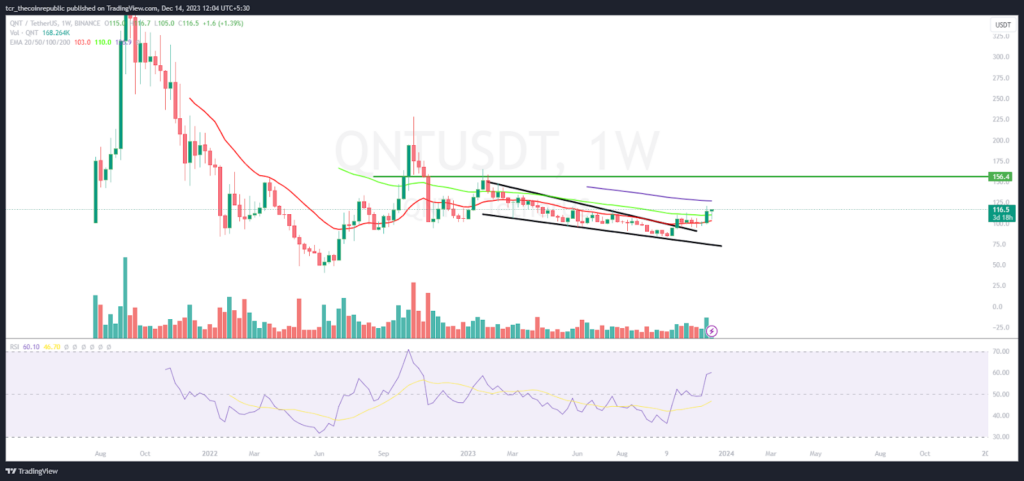
On the weekly charts, the QNT token price has surpassed the trendline of the falling wedge pattern and is close to the 100-day EMA mark. Furthermore, the charts replicating the reversal and a fresh buying action were witnessed in the last sessions.
Summary
The QNT price has sharply rebounded from the demand zone of $100 and is close to the breakout zone of $120. Buyers are showing their dominance and are looking strong on the charts. Moreover, the charts display the uptrend, and bulls persist in extending the rally delivering the outperformance.
Technical Levels
Support Levels: $110 and $100
Resistance Levels: $120 and $125





