
 Home
Home News
News

- 1 The RNDR price showed a breakout and surpassed the trendline of $4.30.
- 2 Buyers are leading the battle and gaining traction in recent sessions.
The RNDR coin price showed a massive surge of more than 20% and has surpassed multiple hurdles in a single go. The chart displays the trendline breakout and the Render token price has escaped the supply zone of $4.00. It is staying in the overbought zone. This cryptocurrency sharply rose from the bottom zone of $1.60, noted a golden crossover, and recovered over 175% in the past few trading sessions.
The RNDR price witnessed a major move and a bullish marubozu candlestick was noted in the last session. Furthermore, the price action delivers the outperformance and bulls look aggressive. They are now setting their eyesight on the round mark of $5. Per the technicals, the Render token price has crashed the sellers’ grip and is ready to surpass the prompt hurdle of $5 in the next sessions. The ongoing trend suggests that the price is ready to reach the swing high of $7 followed by $10 in the next months.

The live price of the RNDR crypto is $4.84 with an intraday gain of 22.45%, showing bullishness on the charts. Moreover, the trading volume increased by 11.32% to $311.72 Million. However, the pair of RNDR/BTC is at 0.000113 BTC and the market cap is $2.59 Billion. Analysts have maintained a buy rating and suggest that the RNDR token may surpass $5 soon.
The RNDR Token on Daily Charts Displays a Breakout
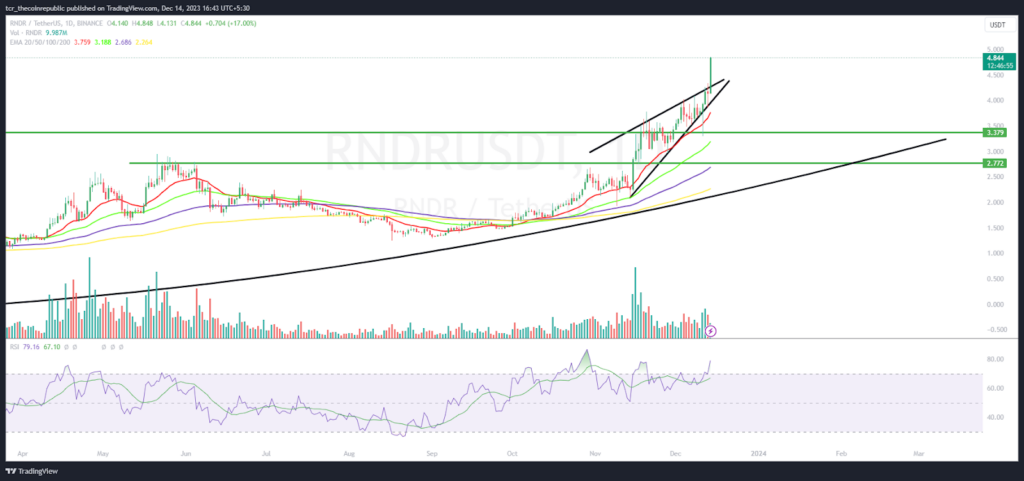
On the daily charts, the RNDR coin price showed a breakout of the rising wedge pattern and has made a huge bullish engulfing candlestick, exhibiting a breakout. Furthermore, the price has overtaken the supply zone of $4.00 and sharp buying momentum was noted in the last session.
The RSI curve stayed in the overbought zone and formed a positive divergence, suggesting a favorable bullish outlook for the upcoming sessions. The MACD indicator showed a bullish crossover and formed green bars on the histogram. It suggests that outperformance will continue for the next sessions.
RNDR On Weekly Charts Displays Rounding Bottom Pattern Breakout
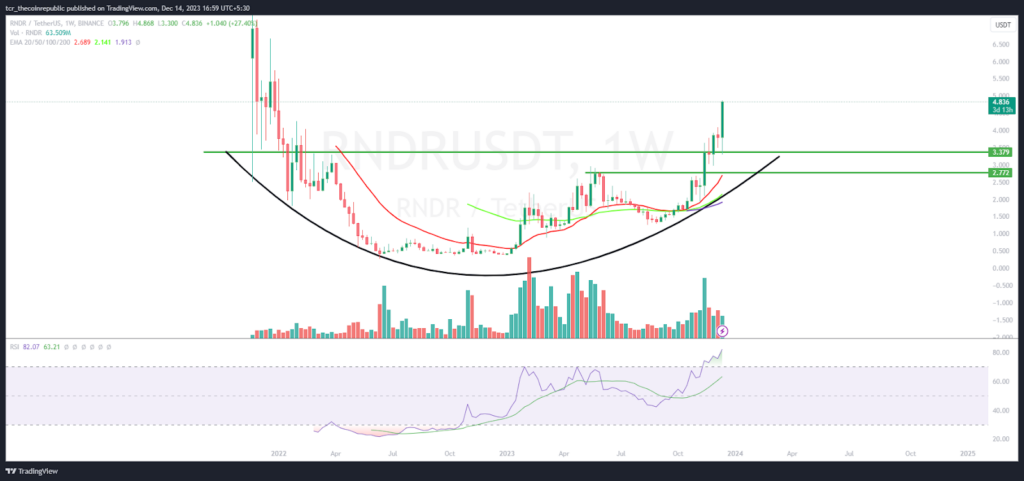
On the weekly charts, the RNDR coin price has replicated a rounding bottom pattern, and the follow-up buying action was noted on the charts. Per the Fibonacci retracement levels, the token price has surpassed the 61.8% zone and a bullish crossover was noted on the charts.
Summary
The RNDR coin price has overtaken the supply barrier of $4 and is approaching the bullish trajectory noted breakout on the charts. Moreover, the price has gained momentum and trapped the sellers, suggesting that the rally will carry forward to the round mark of $5 in the next sessions.
Technical Levels
Support Levels: $4.00 and $3.70
Resistance Levels: $4.80 and $5.00
Disclaimer
The views and opinions stated by the author or any other person named in this article are for informational purposes only and do not constitute financial, investment, or other advice. Investing in or trading crypto or stocks comes with a risk of financial loss.

Adarsh Singh is a true connoisseur of Defi and Blockchain technologies, who left his job at a “Big 4” multinational finance firm to pursue crypto and NFT trading full-time. He has a strong background in finance, with MBA from a prestigious B-school. He delves deep into these innovative fields, unraveling their intricacies. Uncovering hidden gems, be it coins, tokens or NFTs, is his expertise. NFTs drive deep interest for him, and his creative analysis of NFTs opens up engaging narratives. He strives to bring decentralized digital assets accessible to the masses.


