
 Home
Home News
News

- 1 ETC price faced rejection and is hovering near the round mark of $20.
- 2 ETC price shows incisiveness between the bulls and bears.
ETC price stayed near neutrality and is close to the 20 day EMA. It faced rejection which led to rejection. However, the ETC price is replicating buying on dips scenario and pullback was witnessed in the past sessions. Furthermore, the price action displays the double bottom pattern near $15 and a smart recovery was noted following the crypto market pump.

ETC price is trading near the resistance zone of $21 and is facing selling pressure and was rejected from the supply zone of $23. Moreover, the price action is indicating neutral sentiments and did not suggest any rally or a fall, showing consolidation for the upcoming sessions. The ongoing trend highlights profit booking.

The live price of ETC crypto is $20.35 with an intraday drop of 1.15% showing neutrality on the charts. Moreover, the trading volume increased by 8.32% to $224.64 Million. However, the pair of ETC/BTC is at 0.000496 BTC and the market cap is $3 Billion. Analysts have maintained a neutral rating and suggest volatility may continue in the following sessions.
ETC on Daily Chart Shows Rejection From Supply Zone
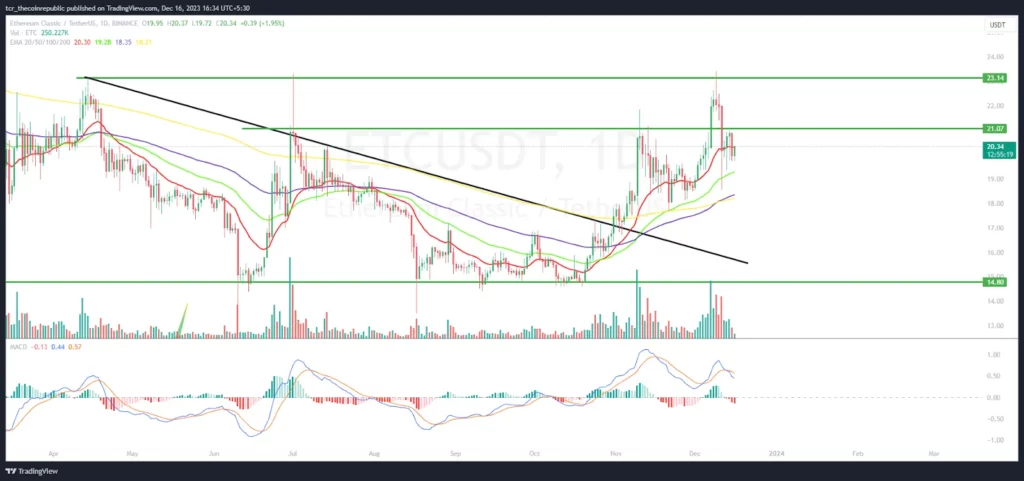
On the daily chart, ETC price is trading near the neutral region and showed a trendline breakout above the resistance mark of $17. Moreover, a positive crossover was witnessed near $17 and buyers led recovery, producing the higher highs pattern. Afterwards, the rally paused and profit booking was noted. The technicals are suggesting that ETC price may continue to face selling pressure and will stay in a narrow range.
The RSI curve stayed in the overbought zone and formed a negative crossover replicating profit booking on the charts. The MACD indicator shows a bearish crossover and formed red bars on the histogram, suggesting that ETC price may retest the 100 day EMA mark near $18 in the coming sessions.
ETC on Weekly Chart Displays Range Bound Moves
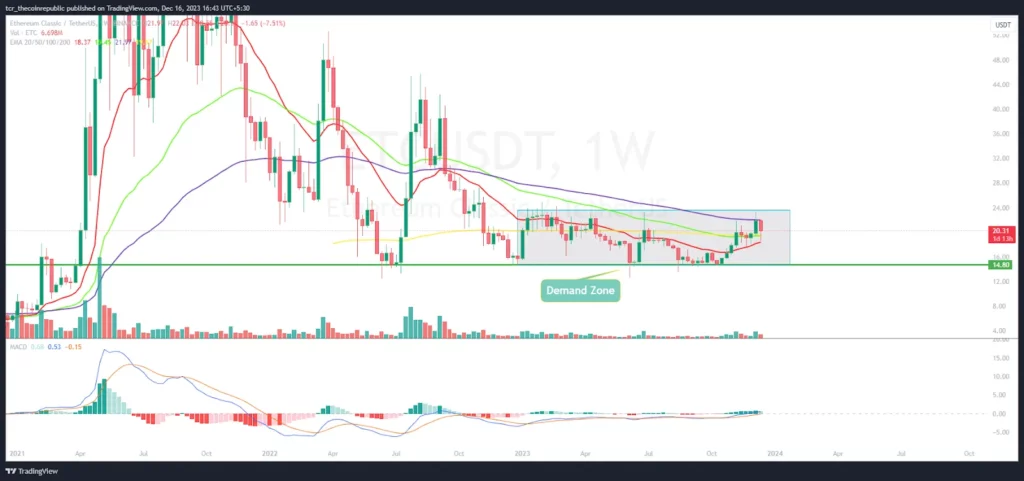
On the weekly chart, ETC price stayed in a narrow range and is close to the 100 day EMA mark near the upper neckline of $21. The sentiments are neutral and buyers need extra pace to exit the cage. If they do not succeed in escaping this zone, it will lead to further consolidation and a negative outlook.
Summary
ETC price stayed close to the 20 day EMA hurdle, showing mild selling pressure in the recent sessions. Moreover, the ETC price faced rejection from the prompt hurdle of $23 and is demonstrating a false breakout.
Technical Levels
Support Levels: $18 and $15
Resistance Levels: $23 and $25
Disclaimer
The views and opinions stated by the author or any other person named in this article are for informational purposes only and do not constitute financial, investment, or other advice. Investing in or trading crypto or stocks comes with a risk of financial loss.
Samuel Ronan, served in the USAF(2009-2015), left active duty after the 2013 government shutdown, disillusioned by the government’s indifference towards the people. In 2017, he ran for DNC Chair, advocating for rural America and the forgotten voter base. In 2018, he ran for Congress as a GOP candidate. Currently, he is running for the position of President of the United States as a GOP candidate. His vision for the future includes: Support for Web 3, Decentralized Technologies, Universal Programs, and Modernizing America’s Economy.


