
 Home
Home News
News
- 1 VET price displayed a vertical spike from the demand zone of $0.02000.
- 2 Buyers have persisted in accumulation and are looking to extend the rally.
VET price surged and persisted in attaining follow-on gains, staying in bullish trajectory. Moreover, the price action implies bullish momentum, and buyers have gained momentum, overtaking the crucial hurdle of $0.02500. Furthermore, a golden crossover was noted, which suggests the positive sensations for VET crypto to resume the uptrend for the following sessions.
VET price is switching into the bullish territory and has surpassed the significant moving averages, furnishing the bullish momentum on the charts. Moreover, the price action denotes the higher high formation, and bulls look aggressive, whereas sellers are noted to be trapped.
The live price of VET crypto is $0.02967, with an intraday drop of 1.31%, showing neutrality on the charts. Moreover, the trading volume increased by 2.32% to $76.62 Million. However, the pair of VET/BTC is at 0.000000719 BTC, and the market cap is $2.02 Billion. Analysts have maintained a neutral rating and suggest volatility may continue in the following sessions.
VET on Daily Chart Displays Follow-on Buying
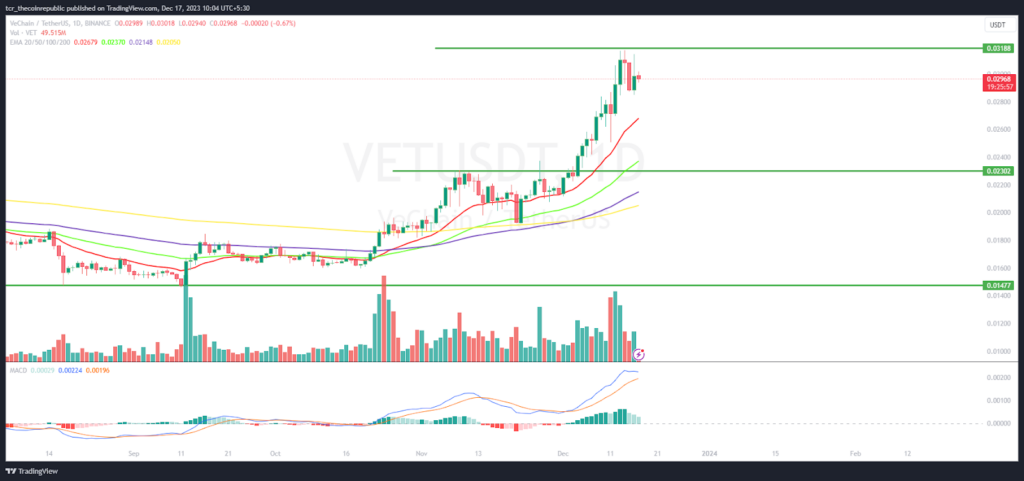
On the daily chart, VET price persisted in unfurling the gains and displayed higher high formation for the past sessions. The price action suggests that buyers are trying to hold the round mark of $0.03000 to extend the buying action. However, a rejection candlestick was formed at the top, identifying the sellers’ strong grip there, and buyers failed to escape. Per the Fibonacci retracement levels, the VET coin price has sustained above the 50% Fib zone, displaying the neutral chart structure.
The Relative strength index (RSI) curve stayed above the midline and exhibited a positive divergence, suggesting a favourable bullish outlook for the upcoming sessions. The MACD indicator shows a bullish crossover and green bars on the histogram
Weekly Chart Shows Double Bottom Pattern
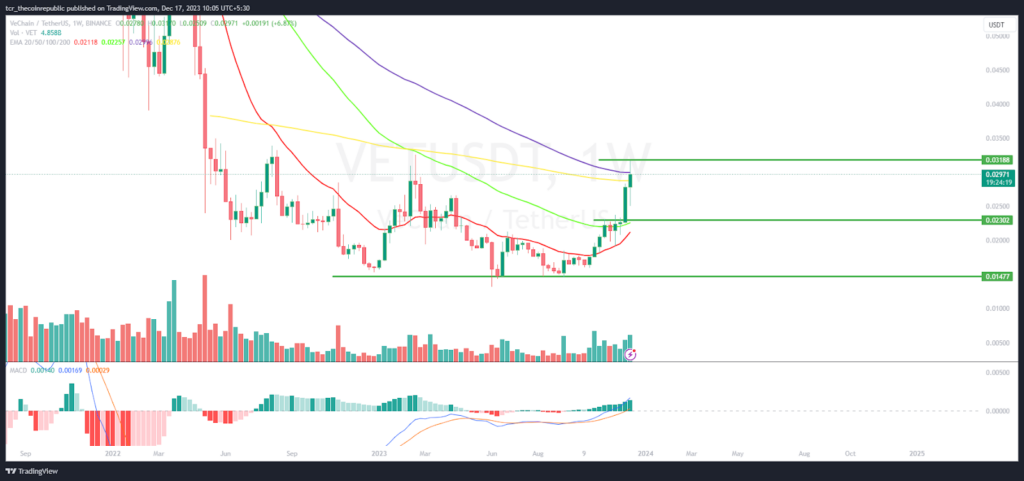
The VET price portrayed a double bottom pattern on the weekly charts, and a breakout candlestick was formed above the 50-day EMA hurdle. However, the VET price is trading close to the 100-day EMA barrier, and buyers are facing rejection. However, the trend is strong, and investors are anticipating a breakout.
Summary
VET price reveals a breakout and has reached the bullish territory, highlighting bulls’ dominance. Moreover, the price action is favoring the bulls and suggests that the VET price will continue to spread the gains, and the rally may stretch to the swing high of $0.03500.
Technical Levels
Support Levels: $0.02800 and $0.02500
Resistance Levels: $0.03200 and $0.03500
Disclaimer
The views and opinions stated by the author or any other person named in this article are for informational purposes only and do not constitute financial, investment, or other advice. Investing in or trading crypto or stocks comes with a risk of financial loss.

Andrew is a blockchain developer who developed his interest in cryptocurrencies while pursuing his post-graduation major in blockchain development. He is a keen observer of details and shares his passion for writing, along with coding. His backend knowledge about blockchain helps him give a unique perspective to his writing skills, and a reliable craft at explaining the concepts such as blockchain programming, languages and token minting. He also frequently shares technical details and performance indicators of ICOs and IDOs.


