
 Home
Home News
News
- 1 DCR price stayed in a narrow range and is halting the gains.
- 2 Buyers are putting efforts to surpass the upper neckline of $16.
DCR price chart shows range-bound movement, suggesting low investor interest over the past few sessions. Moreover, the price action shows that buyers could not scratch the upside range, resulting in the underperformance. DCR price faced rejection from the 200-day EMA hurdle and contemplates consolidation on the chart. If buyers succeed in gaining beyond $16, bulls will gain traction, and DCR price may retest $20 in the following sessions.
DCR price is trading close to the 200-day EMA and is above the 20 and 100-day EMAs, demonstrating neutrality on the chart. DCR crypto did not partake in the crypto market pump and stayed in a narrow range, indicating underperformance on the chart.
The live price of DCR crypto is $14.85, with an intraday gain of 1.20%, showing neutrality on the chart. Moreover, the trading volume increased by 1.20% to $1.20 Million. However, the pair of DCR/BTC is at 0.000345 BTC, and the market cap is $231.79 Million. Analysts have maintained a neutral rating and suggest underperformance may continue in the following sessions.
DCR on Daily Chart Displays Consolidation
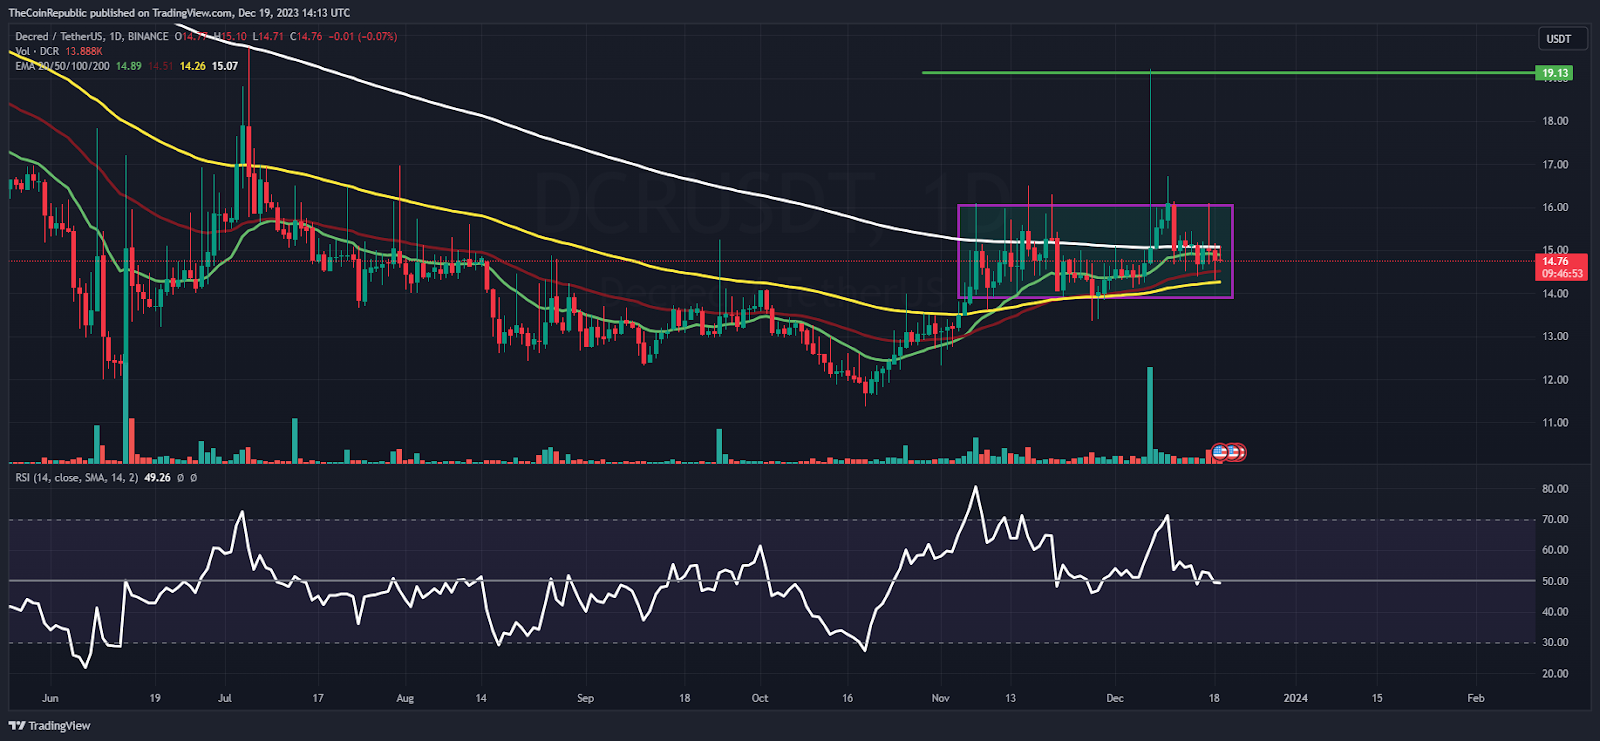
On the daily chart, the DCR price is trading near the immediate resistance mark of $16, exposing sellers’ dominance in recent sessions. Moreover, the technicals show that the DCR price may further consolidate in a narrow range and that the underperformance will continue. Per the Fib levels, the DCR price is trading on the verge of 38.2% Fib zone, confirming the weakness on the chart.
The relative strength index (RSI) curve stayed near 50, showing neutrality on the chart and suggesting a volatile outlook for the following sessions. The MACD indicator shows a bearish crossover and red bars on the histogram, suggesting underperformance in the following sessions.
Weekly Charts Displaying Rejection From 50 Day EMA
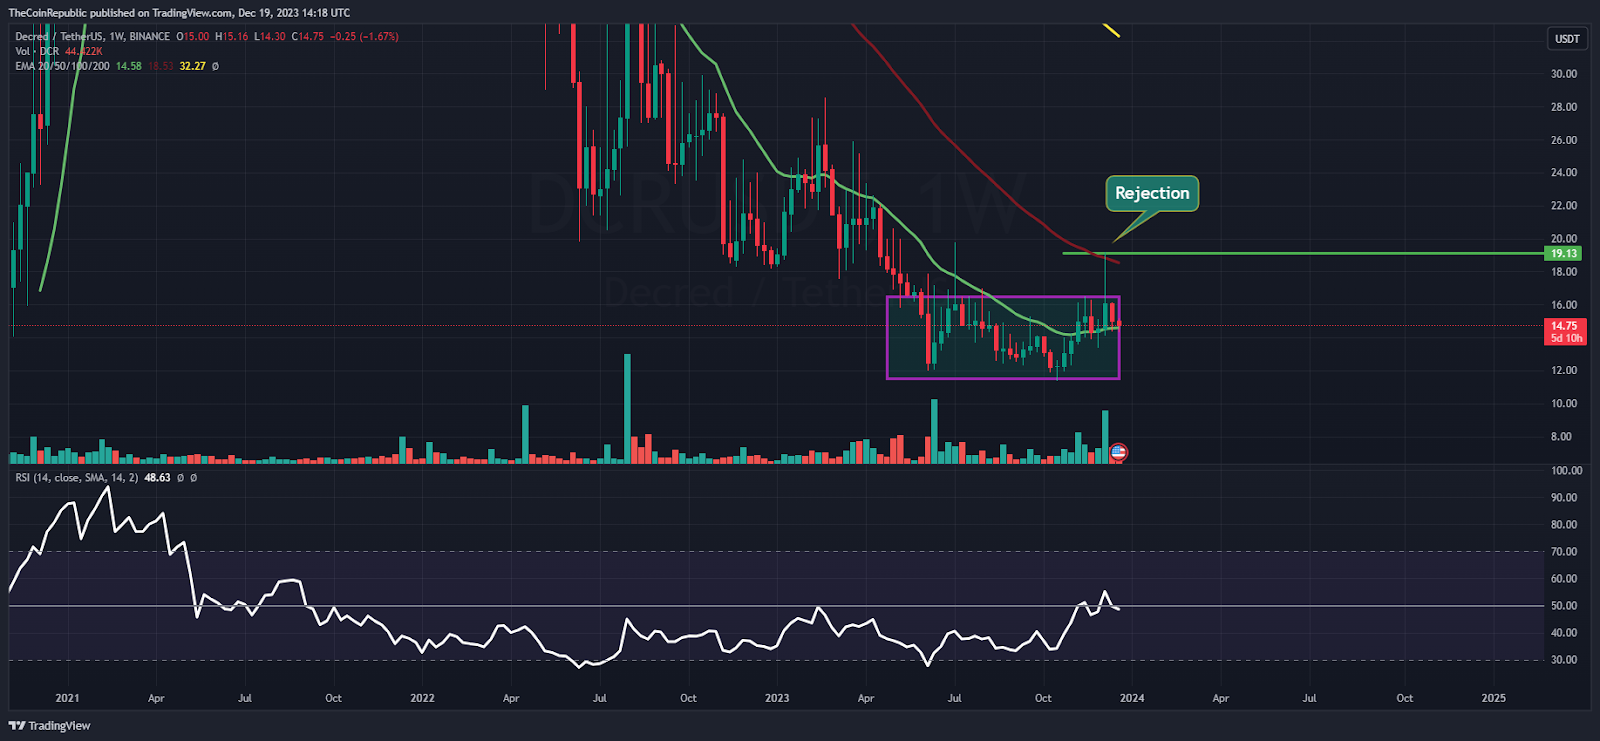
On the weekly chart, the DCR price faced rejection from the 50-day EMA mark and consolidated in the past few sessions. Furthermore, the price action reflects low investor interest in the recent sessions. Due to strong seller grip near the $20 mark, buyers find it challenging to sustain as the underperformance continued.
Summary
DCR price stayed in a narrow range, showing frailty and underperformance in the recent sessions. Moreover, the price action demonstrated the sellers’ dominance, and buyers still have a challenge in accumulating gains beyond the $15 mark. While the RSI is giving neutral signals, the MACD is giving negative signals.
Technical Levels
Support Levels: $13 and $11
Resistance Levels: $15 and $17
Disclaimer
The views and opinions stated by the author or any other person named in this article are for informational purposes only and do not constitute financial, investment, or other advice. Investing in or trading crypto or stocks comes with a risk of financial loss.

Steefan George is a crypto and blockchain enthusiast, with a remarkable grasp on market and technology. Having a graduate degree in computer science and an MBA in BFSI, he is an excellent technology writer at The Coin Republic. He is passionate about getting a billion of the human population onto Web3. His principle is to write like “explaining to a 6-year old”, so that a layman can learn the potential of, and get benefitted from this revolutionary technology.


