
 Home
Home News
News
- 1 Sol price is trading above the key moving averages.
- 2 Solana crypto price is surging, making higher highs on the way.
Solana (Sol) price is gaining momentum and broke above the 20, 50, 100, and 200-day EMAs, indicating bullishness in the previous trading sessions. The crypto has tested the supply zone near $77.50 multiple times, taking rejection. However, buyers have regained their strength and are aiming for the $80.00 level.
The chart structure shows a volatile movement in the previous months, with the crypto witnessing a robust upper momentum. The lower levels near $58.73 acted as a support region.

Furthermore, the crypto’s trajectory shows that beyond $80, the zone is bullish, and a rally could be seen. But, if further rejection takes place, then the crypto will continue to trade in the congestion zone. Similarly, below $58.00, bearishness could be extended.
At press time, Solana crypto was trading at $74.70 with an intraday minor gain of 0.34% breaking below the $74.50 level, showing bullishness on the charts. Moreover, the intraday trading volume is 2.045 Billion. The market cap of Solana crypto is 31.947 Billion.
Technical Analysis of Solana Crypto Price in 1-D Time Frame
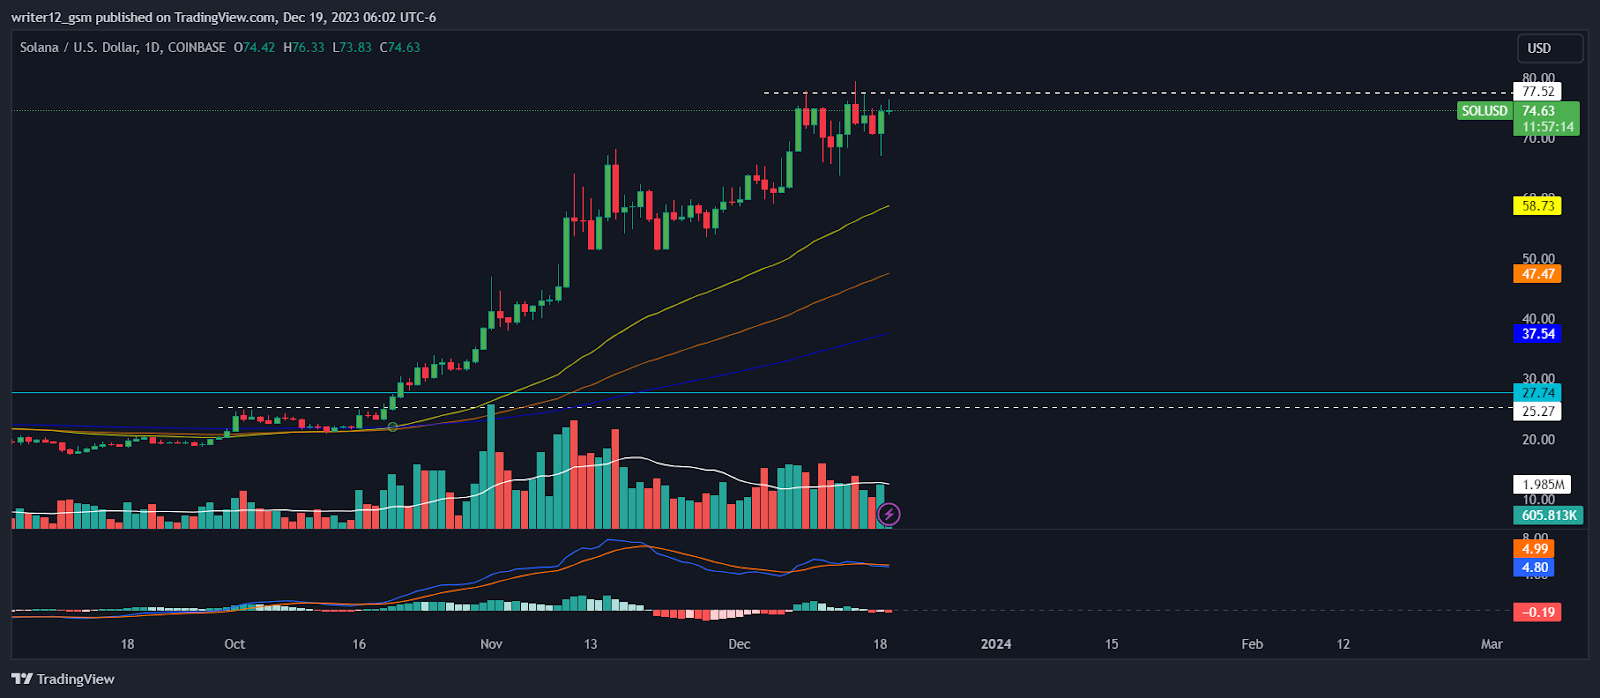
Currently, Solana crypto (USD: SOL) is trading above the 50 and 200-day simple moving averages (SMAs), which are supporting the price momentum.
However, if buying volume adds up, then the price might support bullish momentum by making higher highs and new highs. Hence, the Solana price is expected to move upwards, giving bullish views over the daily time frame chart.
The current value of RSI is 62.11 points. The 14 SMA is above the median line at 64.55 points which indicates that the Solana crypto is bullish.
The MACD line at 4.79 and the signal line at 4.99 are above the zero line. A bearish crossover is observed in the MACD indicator which signals weakness in the momentum of the Sol crypto price.
Short-Time Horizon Analysis

Solana crypto has shown resilience and consolidation in the short time frame, despite the recent volatility. Moreover, the price has found support at the key EMAs, which shows potential for a reversal in the crypto. The RSI curve is near the neutral region at 50, and a positive outlook is expected, indicating bullishness in the crypto. The MACD indicator also shows green bars. A bullish crossover is possible, which signals a recovery.
Summary
Solana (USD: SOL) technical indicators also confirm the upward momentum. The MACD, RSI, and EMA show optimistic signs, indicating that the price will rise steadily. On the 1-day chart, the market sentiment is positive. The candlesticks reveal a confident outlook. However, market participants should resist the fear of missing out and look for solid entry points before taking action.
Technical Levels
Support Levels: $58.73
Resistance Levels: $80.00.
Disclaimer
This article is for informational purposes only and does not provide any financial, investment, or other advice. The author or any people mentioned in this article are not responsible for any financial loss that may occur from investing in or trading. Please do your own research before making any financial decisions

With a background in journalism, Ritika Sharma has worked with many reputed media firms focusing on general news such as politics and crime. She joined The Coin Republic as a reporter for crypto, and found a great passion for cryptocurrency, Web3, NFTs and other digital assets. She spends a lot of time researching and delving deeper into these concepts around the clock, and is a strong advocate for women in STEM.


