
 Home
Home News
News
- 1 OP price surged massively and escaped multiple hurdles in a single go.
- 2 Buyers looked aggressive and persisted in accumulating the gains.
OP price noted a sharp rise above the crucial hurdle of $3.30 and escaped the supply zone with flying colors in recent sessions. Furthermore, the OP price has approached the bullish trajectory, witnessed a golden crossover on the chart and replicates a range breakout. The technicals are indicating a trend reversal and buyers are holding the top with strength and trapped the sellers, resulting in a short covering rally. Amid the crypto pump, OP price surged by over 190% in recent weeks and witnessed bulls dominance.
OP price is trading above the significant moving averages and is showcasing a bullish marubouzu candlestick in the yesterday session, replicating buyers control over sellers and led a sharp up move. Additionally, the OP price has surpassed the supply zone barrier of $2.80 and $3.20 in a single go which trapped the sellers positions. Per the Fibonacci retracement levels, OP price has escaped the 61.8% zone and is heading to reach $4 which is the challenge for the bulls.
The live price of OP crypto is $3.61, with an intraday gain of 12.90%, showing bullishness on the chart. Moreover, the trading volume increased by 22.10% to $837.20 Million. However, the pair of OP/BTC is at 0.0000824 BTC, and the market cap is $773.95 Million. Analysts have maintained a bullish rating, suggesting that outperformance will continue in the following sessions.
OP on Daily Chart Shows Range Breakout
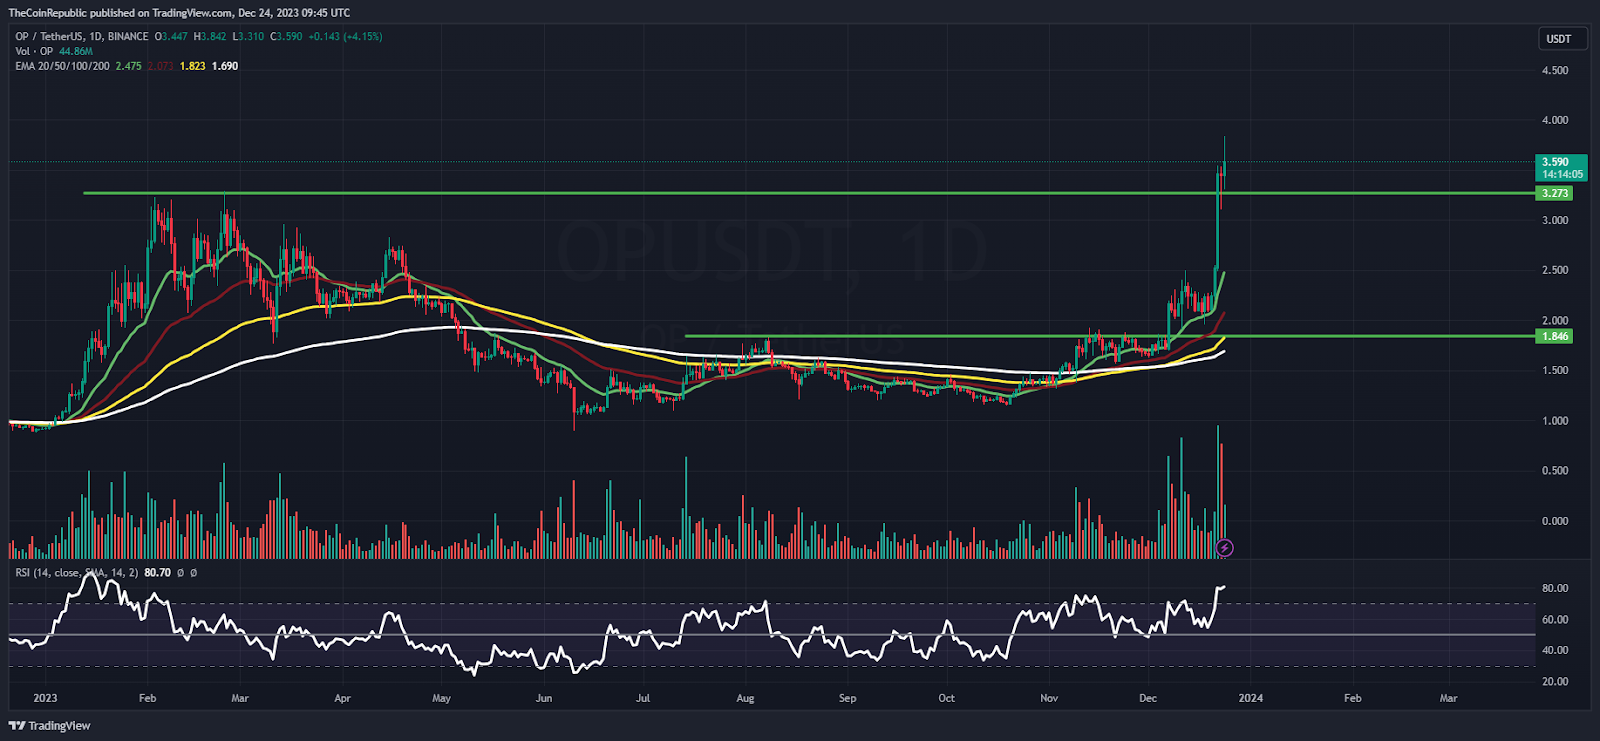
On the daily chart, OP price showcased a range breakout and escaped multiple hurdles decisively, replicating bullish momentum in the recent sessions. The price action shows buyers’ accumulation and that investors have persisted in delivering their interest and putting efforts to surpass $4 soon.
The relative strength index (RSI) curve stayed in the overbought zone and formed a positive divergence suggests that buyers have gained traction and will lift OP price beyond $4 soon. The MACD indicator shows a bullish crossover and green bars on the histogram suggesting an optimistic outlook for the following sessions.
Weekly Chart Displays Double Bottom Formation
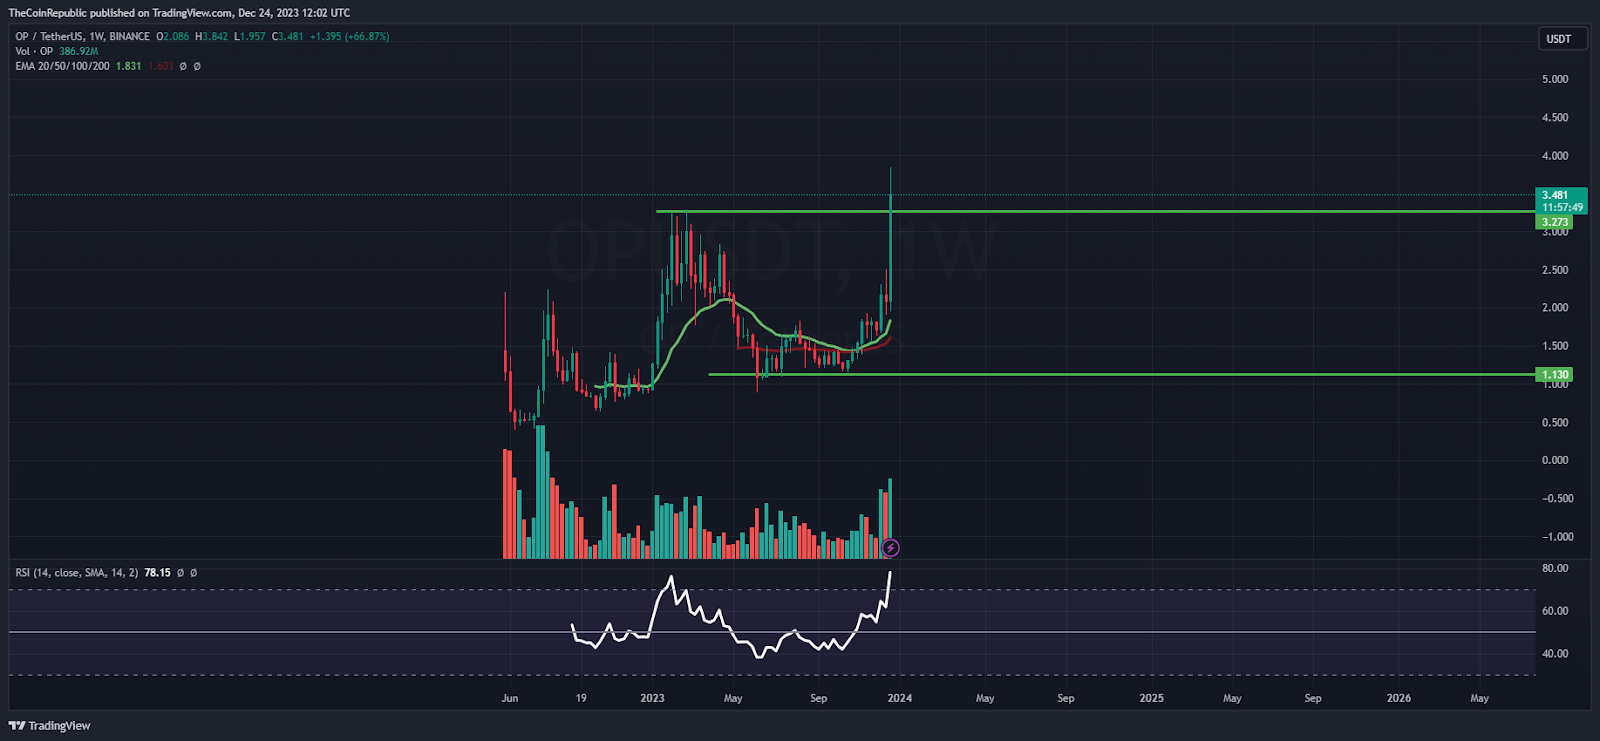
On the weekly chart, OP price reversed the moves and rebounded from the bottom zone of $1 and led a sharp up move in the recent sessions. Moreover, the price action is favouring the bulls guiding bullishness on the charts. Per the ongoing trend, OP price has escaped the ATH (all time high) barrier of $3.20 and is bounced to the uncharted territory.
Summary
OP price showcased a 52 week breakout and it flew away from the sellers vision to the blue sky zone above $3.20 delivering massive bullish momentum. Moreover, the trend is favoring the bulls. Further buying action will raise OP price toward $4 soon.
Technical Levels
Support Levels: $3.30 and $3.00
Resistance Levels: $4 and $4.20
Disclaimer
The views and opinions stated by the author or any other person named in this article are for informational purposes only and do not constitute financial, investment, or other advice. Investing in or trading crypto or stocks comes with a risk of financial loss.

Andrew is a blockchain developer who developed his interest in cryptocurrencies while pursuing his post-graduation major in blockchain development. He is a keen observer of details and shares his passion for writing, along with coding. His backend knowledge about blockchain helps him give a unique perspective to his writing skills, and a reliable craft at explaining the concepts such as blockchain programming, languages and token minting. He also frequently shares technical details and performance indicators of ICOs and IDOs.


