
 Home
Home News
News
- 1 Litecoin crypto is currently trading at $75.47 with a 0.75% decline in the last 24 hours (press time).
- 2 The Litecoin price is observing an advance of 8.65% in the last 7 days.
- 3 The LTC market capitalization is $5.588 Billion.
Litecoin trying to bounce back. By evaluating the price data of the LTC coin, it is observed that it is heading toward upper levels. The price increased by 8.65% in the last seven days and we can say that Litecoin performed well last week.
From its peak price of $410.26, it fell 80.50% in the last 2 years. However, the current market sentiments are neutral. A respectable volume is noted on Litecoin at present. As of now, bulls are trying to reach upper levels and take control of bears.
The price of Litecoin (LTC) has jumped above 50 and 200 EMAs, which suggests that the price is entering a bullish trend. If the buyers continue to push the price up, the coin’s value may surge even further in the upcoming week.
The price has been consolidating near key EMAs in the previous month which suggests a tough fight between bulls and bears over the price.
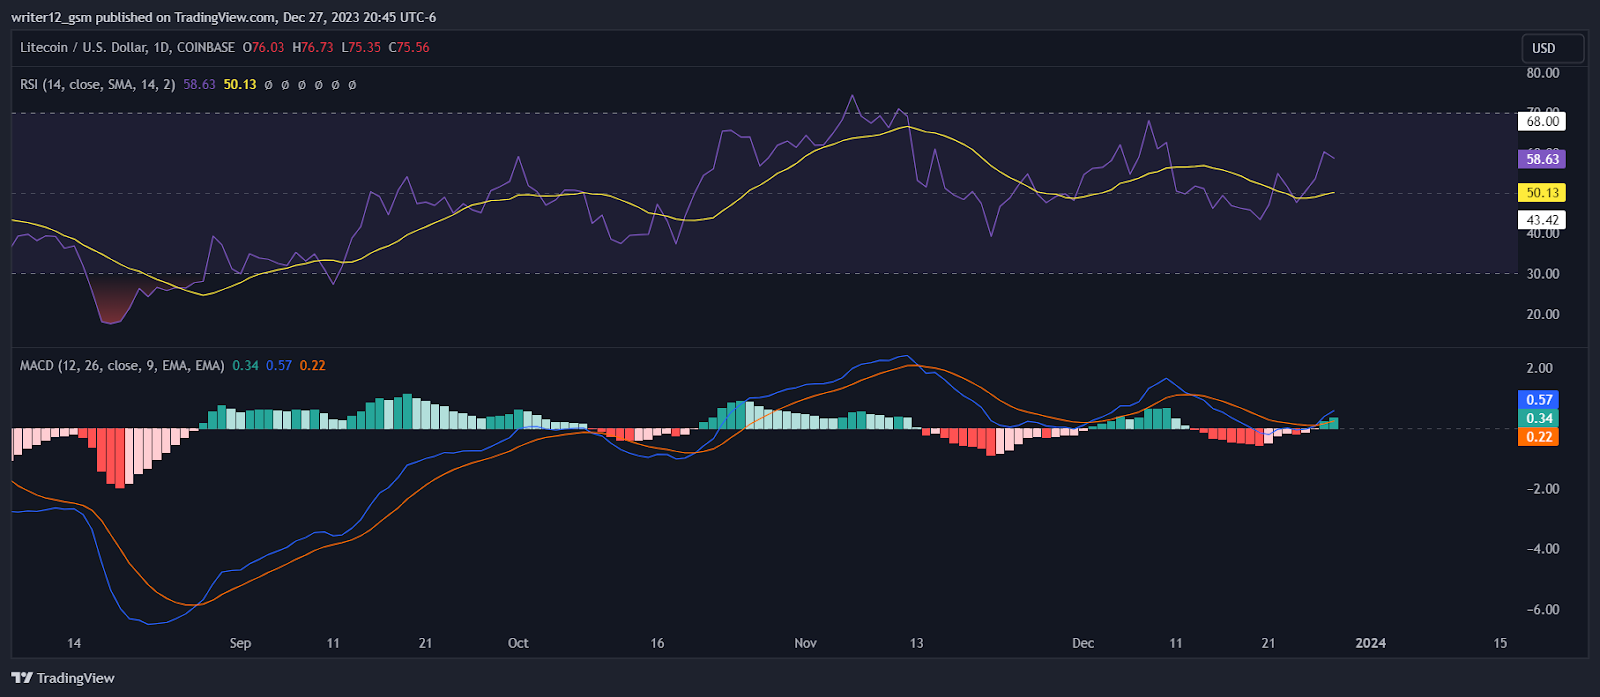
The technical indicator MACD is also in the positive territory. The MACD line at 0.57 and signal line at 0.23 is above the zero line, suggesting that the MACD is heading toward positive territory and is giving bullish signals.
The current value of RSI is 58.89 points. The 14 SMA line is currently close to the median line, around 50.16 points which shows bullish sentiment in the market. The bullish trend is demonstrated by the 14-day SMA curve leading above the median line. As the price is in overbought territory, the market is displaying bullish sentiments.
The price bounced off of its significant trendline and is moving towards the support level. If the price crosses above the trendline, it will likely test the next resistance level and if it fails to break above the resistance, it will retrace to the current support level.
The MACD indicator shows a bullish divergence between the price and the indicator, suggesting a possible reversal of the downtrend. The RSI indicator is near the oversold zone, indicating that the selling pressure is weakening. The chart below illustrates the price action, the trendline, the support and resistance levels, and the indicators.
Conclusion
In Litecoin (LTC), we can see a tough fight between bulls and bears, as the coin is trying to come back. The price action shows that the price may grow more in the upcoming days if the upper resistance level breaks. The LTC price shows an optimistic scenario at the moment. Major reliable indicators like EMAs, RSI, and MACD give positive signals about Litecoin. Hope is developed among investors because of the good performance of the coin in recent times.
Technical Levels:
- Support Level: $71.83.
- Resistance Level: $78.46.
Disclaimer
The analysis given in this article is for informational and educational use only. Do not take this information as financial or trading advice. Trading and investing contain financial risk. Before making any investment or trading decision, please consider your risk profile and circumstances.

Steefan George is a crypto and blockchain enthusiast, with a remarkable grasp on market and technology. Having a graduate degree in computer science and an MBA in BFSI, he is an excellent technology writer at The Coin Republic. He is passionate about getting a billion of the human population onto Web3. His principle is to write like “explaining to a 6-year old”, so that a layman can learn the potential of, and get benefitted from this revolutionary technology.


