
 Home
Home News
News
- 1 TRON price chart shows narrow range bound moves and a consolidation phase.
- 2 TRX price is tightening gains near the 20 day EMA mark.
TRON price portrayed consolidation and is hovering near the 20-day EMA, which signifies low investor interest on the chart. Moreover, the price action shows the indecisiveness between the bulls and bears, resulting in a hanging TRX price between the cluster of $0.10500-$0.11000 for the past sessions. TRX price displays a range-bound move and pauses the bull move amid the positive global sentiments.
TRX price is trading on the 20 and 50-day EMAs, where buyers have persisted in holding the gains and are plotting weakness on the charts. Per the Fibonacci retracement zones, TRX price is switching gains near the 38.2% level. However, TRX price has rebounded from the bottom zone of $0.06000 and surged over 65% in the recent weeks.
The live price of TRON (TRX) is $0.1061, with an intraday gain of 1.20%, showing neutrality on the chart. Moreover, the trading volume increased by 2.47% to $446.12 Million. However, the pair of TRX/BTC is at 0.0000246 BTC, and the market cap is $9.52 Billion. Analysts have maintained a bullish rating, suggesting that volatility will continue in the following sessions.
TRON on Daily Chart Shows Cage Formation
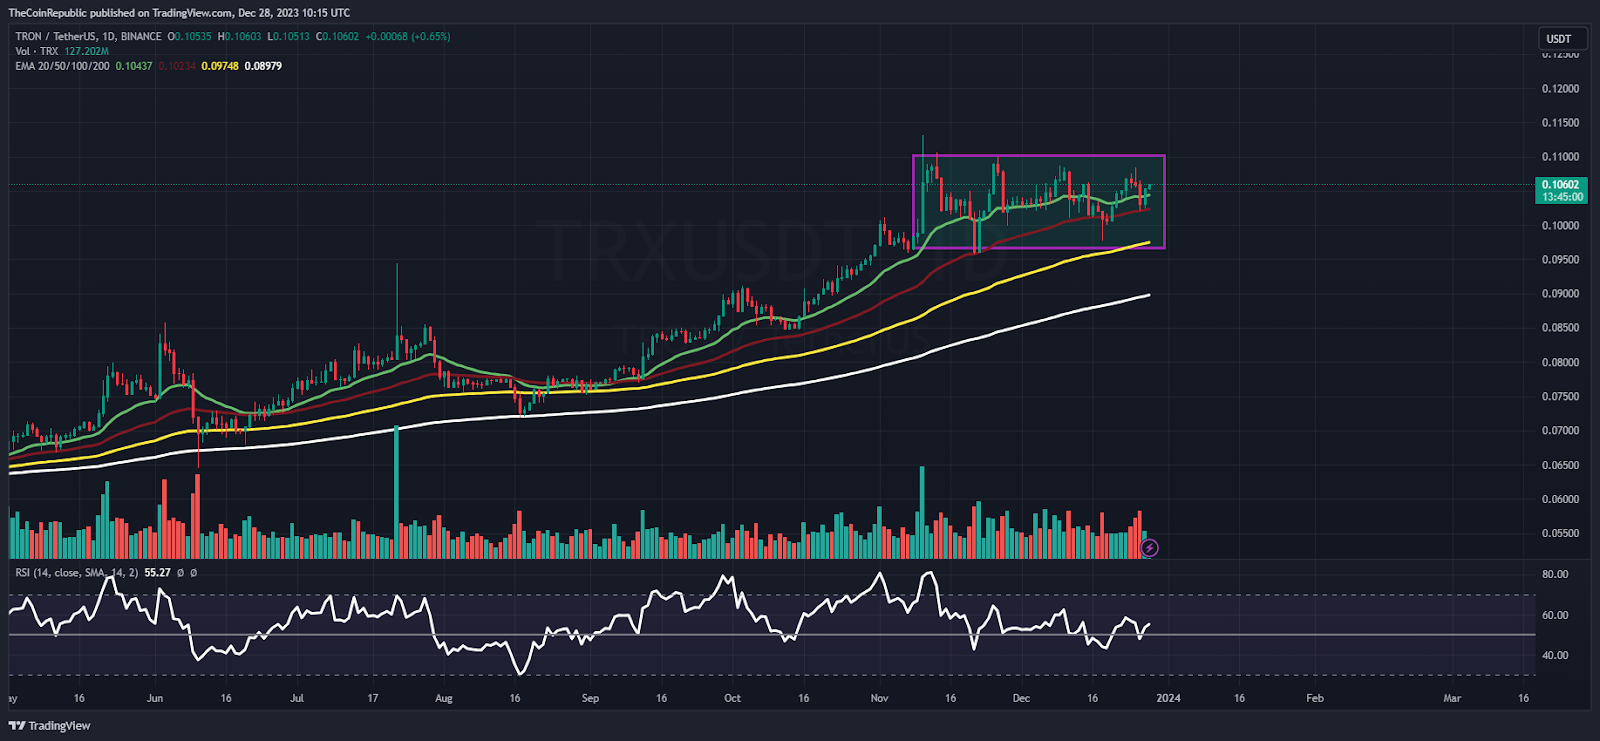
On the daily chart, the TRON price is guiding a mixed stance and is holding the buying momentum but has failed to accelerate gains. However, the trend is neutral, and sellers did not successfully drag the gains despite several attempts and are still trying to throw the TRX price toward the 200-day EMA mark.
The relative strength index (RSI) curve is close to the midline, forming a positive divergence, suggesting that the TRX coin is likely to show bullishness soon. The MACD indicator showed a bearish crossover and formed red bars on the histogram, indicating mild profit booking on the charts.
Weekly Charts Displays Positive Crossover
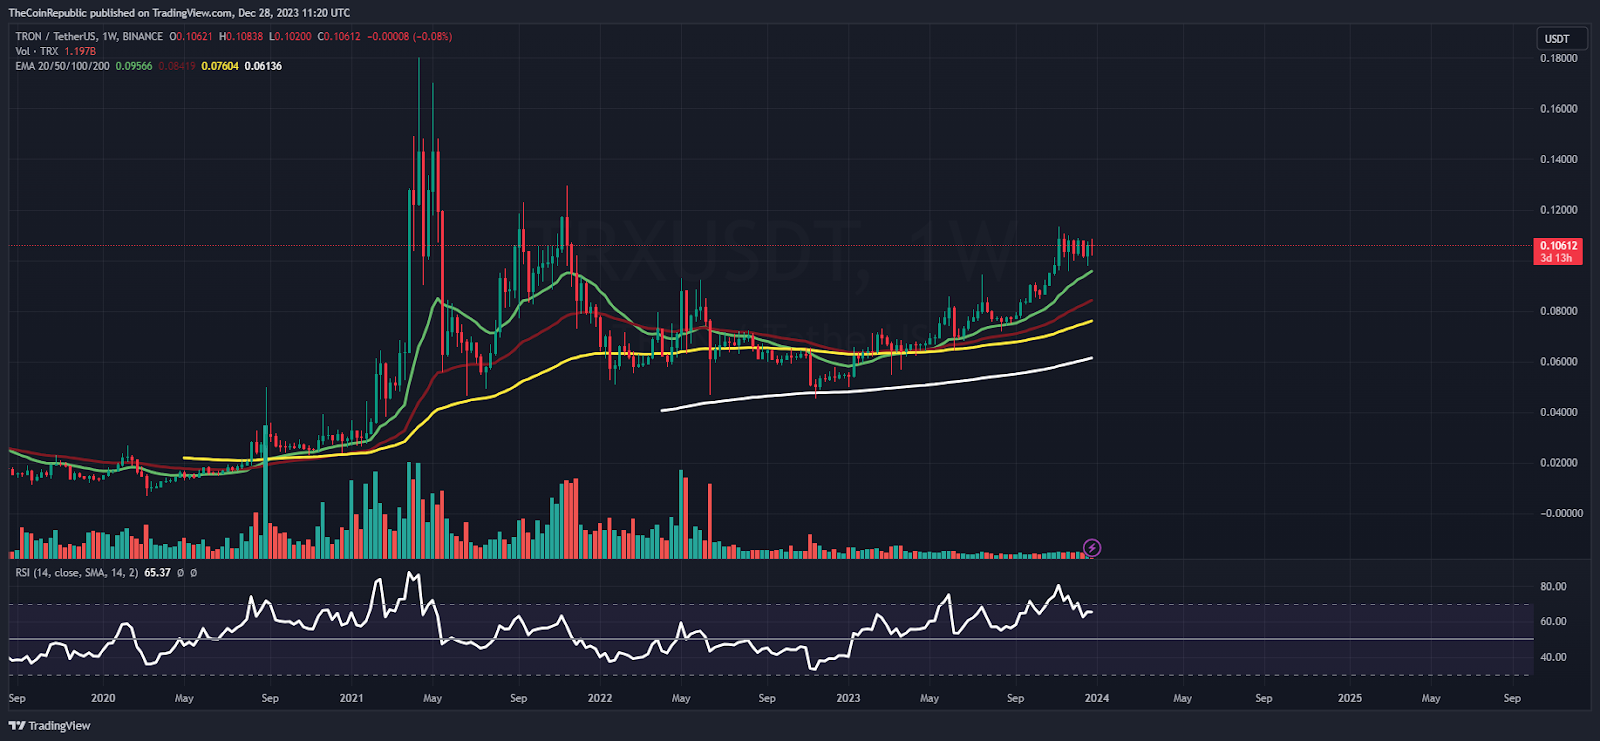
On the weekly chart, TRX price has revealed a pullback and noted a remarkable up move demonstrating the buyer’s accumulation in the recent sessions. Moreover, the price action shows that the TRX coin is managing the gains above the round mark of $0.10000 decisively and is replicating a somewhat positive stance.
Summary
TRON price is guiding a mixed stance and is hovering near the 20-day EMA mark, replicating range-bound moves. Moreover, the technicals confirm a consolidation phase and direct neutral projections for the upcoming sessions.
Technical Levels
Support Levels: $0.10300 and $0.10000
Resistance Levels: $0.10700 and $0.11000
Disclaimer
The views and opinions stated by the author or any other person named in this article are for informational purposes only and do not constitute financial, investment, or other advice. Investing in or trading crypto or stocks comes with a risk of financial loss.

Nancy J. Allen is a crypto enthusiast, with a major in macroeconomics and minor in business statistics. She believes that cryptocurrencies inspire people to be their own banks, and step aside from traditional monetary exchange systems. She is also intrigued by blockchain technology and its functioning. She frequently researches, and posts content on the top altcoins, their theoretical working principles and technical price predictions.


