
 Home
Home News
News
- 1 DOT price showcased higher high swings and is heading toward $10.
- 2 Polkadot coin is reflecting bullish bias and depicts an uptrend on the chart.
DOT coin retrieved resilience and has acquired gains above neutrality, illustrating an uptrend on the charts. Moreover, the Polkadot price has fled the critical hurdle of $5, and a golden crossover has been spotted. Furthermore, the DOT price has climbed above the channel’s top, demonstrating bullish dominance. However, the buyers have failed to reach $10 and re-entered the channel, highlighting the buyers’ accumulation in the recent sessions.
DOT price is trading above the significant moving averages and is sustaining gains above the barrier of $8. Polkadot gained a fresh reversal from the lows of $3 and surged over 160% in the recent sessions. DOT coin has also ended correction and acquired fresh momentum on the charts. Per the technicals, the short covering will extend further, and the DOT price may climb above $10 soon.
The live price of Polkadot (DOT) is $8.58, with an intraday drop of 1.78%, showing neutrality on the chart. Moreover, the trading volume increased by 5.47% to $468.39 Million. However, the pair of DOT/BTC is at 0.000200 BTC, and the market cap is $11.48 Billion. Analysts have maintained a bullish rating, suggesting that outperformance will continue in the following sessions.
DOT on Daily Chart Displays Rising Parallel Channel
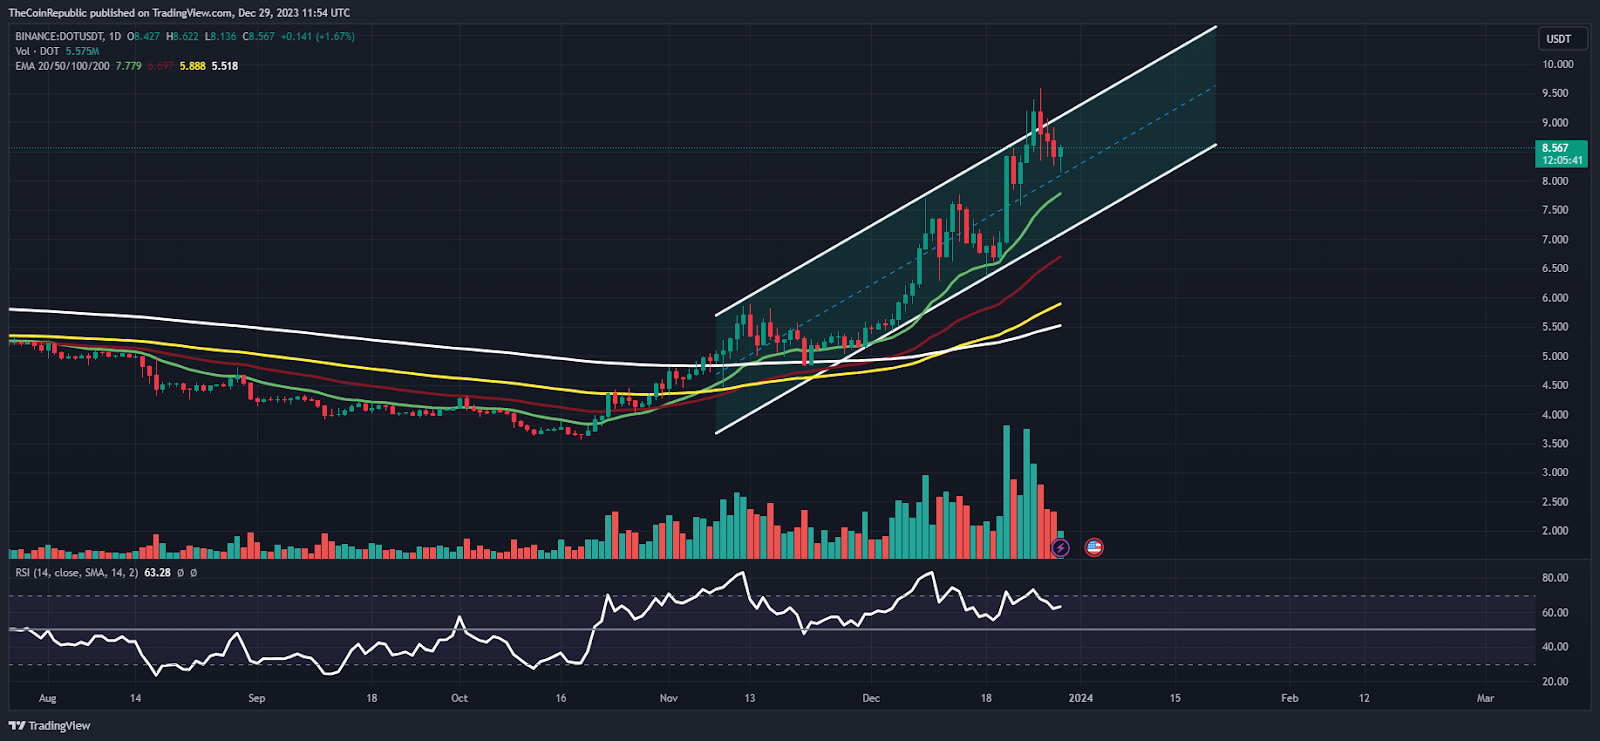
On the daily chart, DOT price has reached bullish territory and continued to gain, showcasing buying momentum in recent sessions. Moreover, the price action shows that the bear cartel was trapped due to the sharp rebound and is covering their positions because of the fear, resulting in a bounce from the 20-day EMA.
The relative strength index (RSI) curve stayed above the midline near 65, suggesting that the upcoming sessions will show a neutral outlook. The MACD indicator shows a bullish crossover and formed green bars on the histogram, suggesting that the DOT price will reach $10 soon.
Will DOT Price Escape the 200 Day EMA Hurdle?
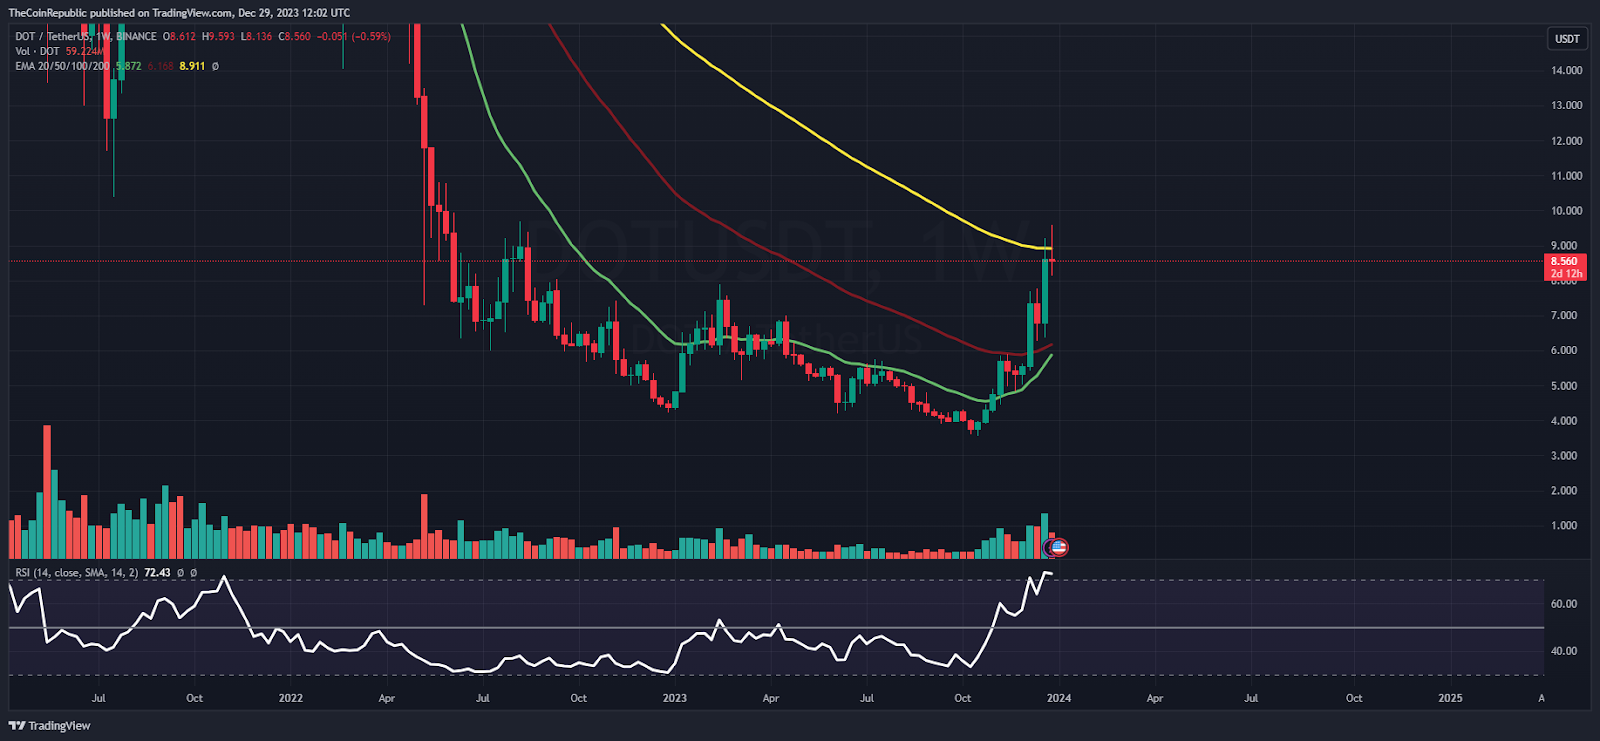
On the weekly chart, DOT price has showcased a falling wedge breakout and has acquired traction, which lifts Polkadot to retest the 200-day EMA and is now at a make-or-break zone. If buyers succeed in crossing the hurdle, it will take DOT to the $12 mark. However, if it is rejected from there, it will retest the 50-day EMA near $6.
Summary
DOT price has escaped the neutral region and approached the bullish zone above $6, reflecting outperformance in the recent sessions. Moreover, the price action shows the buyer accumulation and has persisted in delivering bullishness amid the crypto market rally.
Technical Levels
Support Levels: $8 and $7.60
Resistance Levels: $9 and $10
Disclaimer
The views and opinions stated by the author or any other person named in this article are for informational purposes only and do not constitute financial, investment, or other advice. Investing in or trading crypto or stocks comes with a risk of financial loss.

Andrew is a blockchain developer who developed his interest in cryptocurrencies while pursuing his post-graduation major in blockchain development. He is a keen observer of details and shares his passion for writing, along with coding. His backend knowledge about blockchain helps him give a unique perspective to his writing skills, and a reliable craft at explaining the concepts such as blockchain programming, languages and token minting. He also frequently shares technical details and performance indicators of ICOs and IDOs.


