
 Home
Home News
News
- 1 FLOW price showed a range breakout and took support on the 20 day EMA.
- 2 Buyers are looking for a pullback and are not gaining as of now.
FLOW price convalesced from the demand zone of $0.400 and cited a comeback in recent sessions. Moreover, the price action exhibits buyer accumulation and a range breakout. Recently, the FLOW coin punched the psychological round mark of $1 but did not sustain long enough. The ensuing profit booking which was noted tossed the FLOW price to the 20-day EMA.
FLOW price is trading above the key moving averages and is upholding gains in the bullish territory, displaying bullish beliefs. Furthermore, the chart shows the rising parallel channel, and the FLOW coin persists in lengthening gains. For the past sessions, buying momentum was witnessed, and higher high swings ushered the FLOW price to contend bullish territory.

The live price of the FLOW coin is $0.8989, with an intraday gain of 1.83%, showing bullishness on the chart. Moreover, the trading volume increased by 3.78% to $45.87 Million. However, the pair of FLOW/BTC is at 0.0000214 BTC, and the market cap is $946.14 Million. Analysts have maintained a bullish rating, suggesting the FLOW price will continue to surge in the following sessions.
FLOW on Daily Chart Displays Rising Parallel Channel
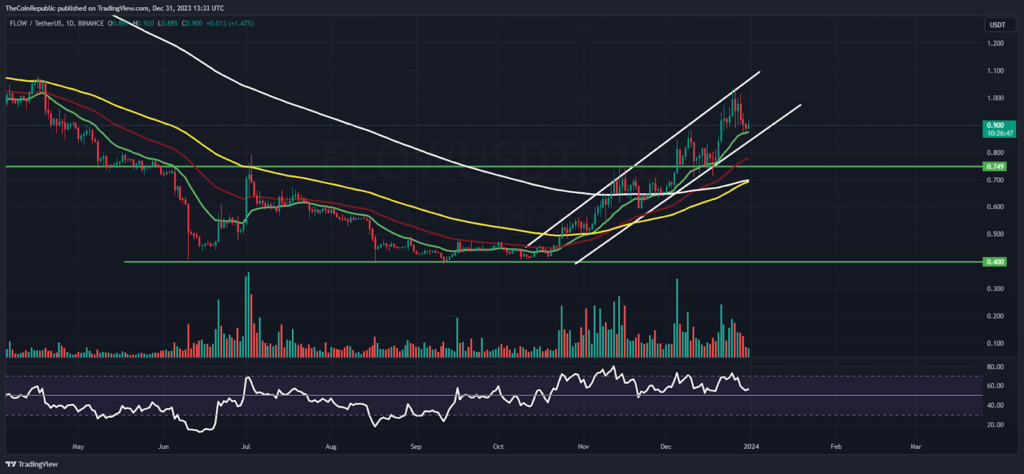
On the daily chart, the FLOW price has been overhauled from the bottom zone and poured gains above neutrality in the past few sessions. However, the FLOW coin faced downward pressure from the channel’s top near $1 and is bearing gains near the 20-day EMA. Per the Fibonacci retracement levels, FLOW coin is trading above the 50% zone above the mid bollinger band.
The relative strength index (RSI) curve endured above the midline near 65, showcasing a bullish crossover retreat on the chart. Moreover, the MACD indicator formed green bars on the histogram highlights strong performance in the past few sessions.
Weekly Charts Reflects Falling Wedge Breakout
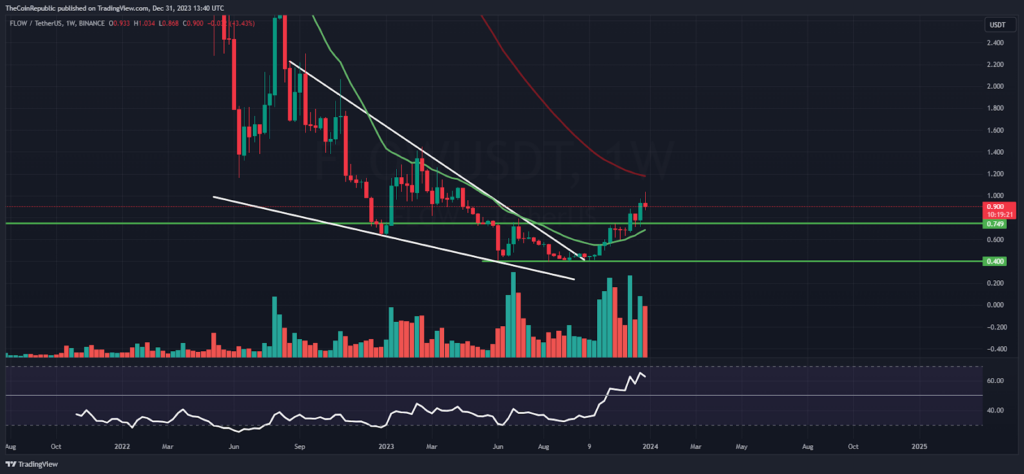
On the weekly chart, the FLOW coin reminisced a trend reversal, rebounded from the demand zone of $0.400, and finally ended the correction. Moreover, the technicals are implying the optimistic buy signal and are suggesting that the FLOW coin will pull back and flee the prompt swing burden of $1 in the coming sessions.
Summary
FLOW price echoes outperformance and is shelving for a pullback to ascend above $1, the supply zone. Furthermore, the trend is bullish, and buyers have prevailed in accumulation, which pinches the FLOW coin beyond the encumbrances and the 20-day EMA mark. Additionally, the follow-on buying momentum reveals investor interest and the FLOW coin will soon flee the psychological round mark of $1.
Technical Levels
Support Levels: $0.8500 and $0.8300
Resistance Levels: $0.9300 and $1
Disclaimer
The views and opinions stated by the author or any other person named in this article are for informational purposes only and do not constitute financial, investment, or other advice. Investing in or trading crypto or stocks comes with a risk of financial loss.

Adarsh Singh is a true connoisseur of Defi and Blockchain technologies, who left his job at a “Big 4” multinational finance firm to pursue crypto and NFT trading full-time. He has a strong background in finance, with MBA from a prestigious B-school. He delves deep into these innovative fields, unraveling their intricacies. Uncovering hidden gems, be it coins, tokens or NFTs, is his expertise. NFTs drive deep interest for him, and his creative analysis of NFTs opens up engaging narratives. He strives to bring decentralized digital assets accessible to the masses.


