
 Home
Home News
News
- 1 FXS price showed an up move and is directing the bullish sentiments.
- 2 Buyers are ruling the battle and persisted in accumulating the gains.
FXS price showed a massive recovery from the lows of $5 and has retained neutrality in the recent sessions. Frax share price is stretching the gains, reflecting bullish sentiments, and is gaining traction. Furthermore, the FXS price will crash the supply zone of $10 to initiate a breakout. Frax share price is trading in a channel and has persisted in delivering follow-on buying.
FXS share price is trading above the key moving averages and is heading to surpass the immediate resistance zone of $10. Furthermore, the trend is intact, and buyers have gained strength and succeeded in defeating the bear cartel. Additionally, the sellers are covering their positions, whereas bulls have added long positions. However, Frax share needs to surpass $10 to initiate a bounce to spread the bullish wave, whereas if the FXS price slips below $9.30, it will retrace more and retest $9 soon.

The live price of the Frax share (FXS) coin is $9.601, with an intraday gain of 11.63%, showing bullishness on the chart. Moreover, the trading volume increased by 5.08% to $35.81 Million. However, the pair of FXS/BTC is at 0.000210 BTC, and the market cap is $1.72 Billion. Analysts have maintained a bullish rating, suggesting the FXS price will continue to surge in the following sessions.
Daily Charts Showcased Trend Reversal
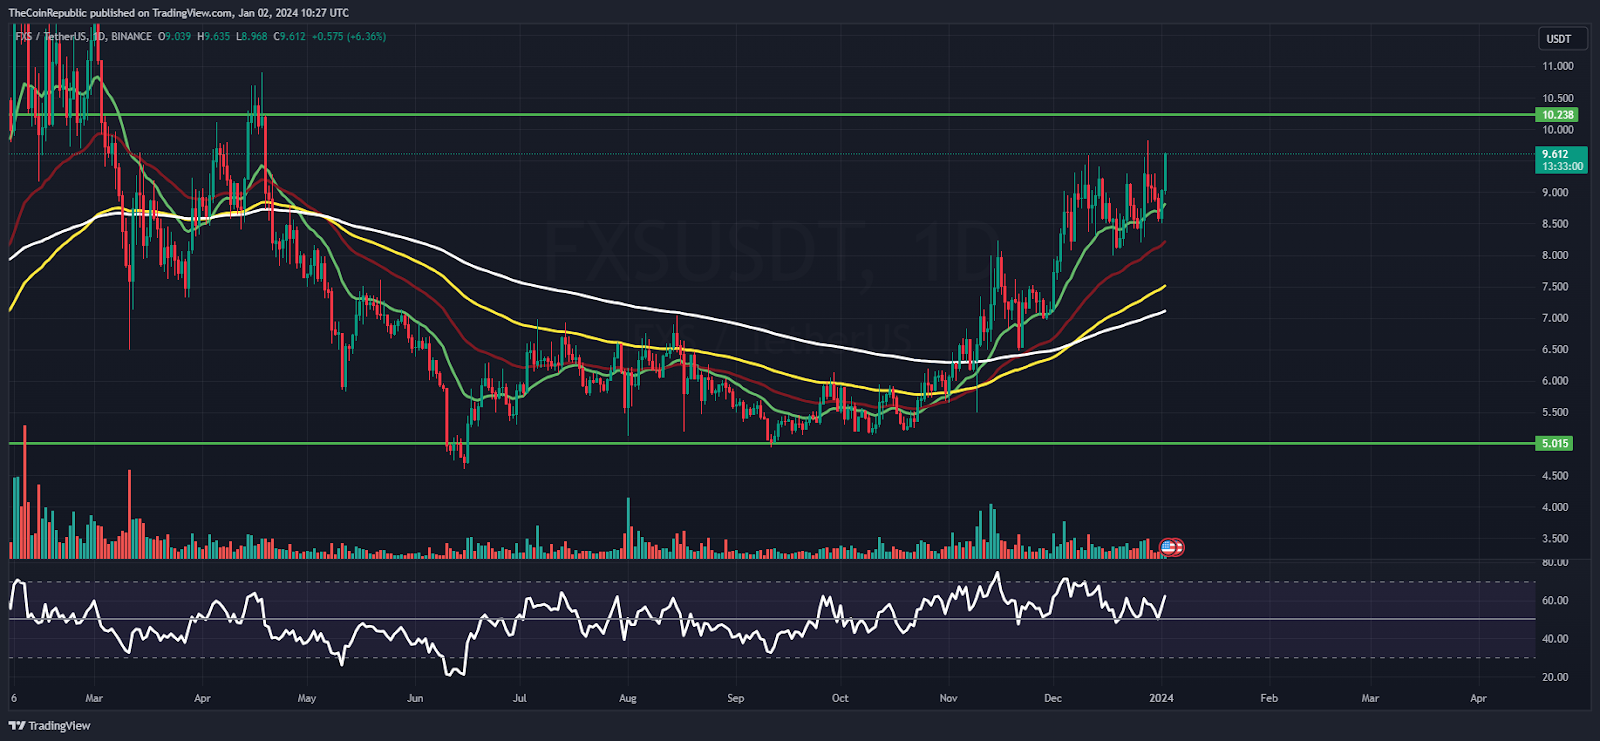
On the daily chart, FXS price showcased a bullish crossover and has surged over 30% in the recent sessions. Moreover, the price action displayed higher high swings and reflected a bullish move in the past sessions. Buyers looked aggressive and persisted in stretching the gains despite the indecisiveness in the crypto market.
The relative strength index (RSI) curve stayed above the midline above 55, showing a neutral outlook. The MACD indicator showed a bullish crossover and formed green bars on the histogram, suggesting that Frax share will continue to sparkle the gains and glimpse bullishness in the following sessions.
Will FXS Price Surpass 200 Day EMA Hurdle?
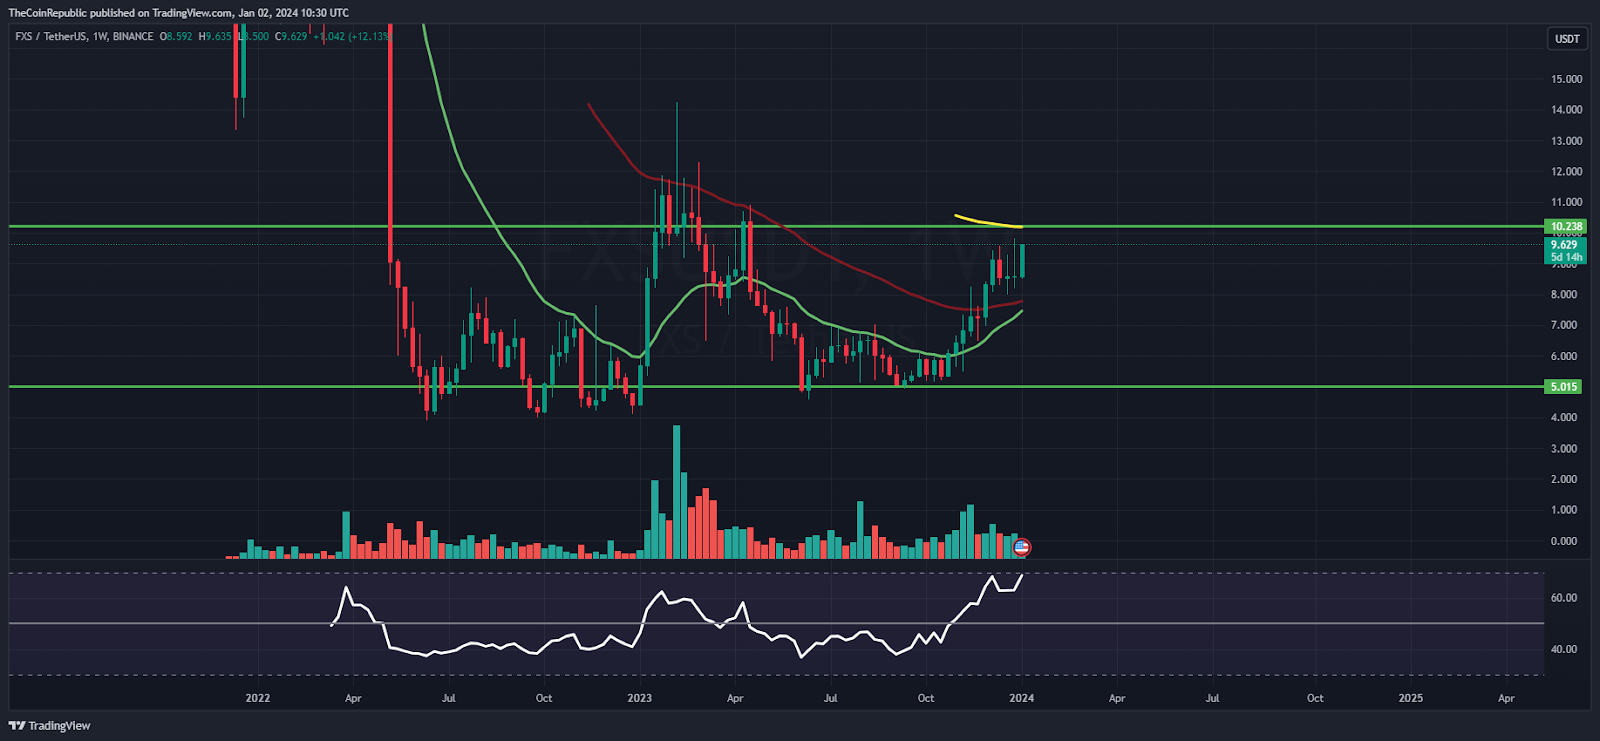
On the weekly chart, FXS price showed a classic W pattern and has surpassed the 20-day EMA barrier, whereas FXS price is still below the 200-day EMA mark, and buyers have a challenge to cross. Moreover, the trend is strong, and buyers are gaining strength and trying their best to escape the hurdle.
Summary
FXS share price has retained a bullish trajectory, is spraying gains amid the market’s indecisiveness, and has persisted in strengthening gains. Moreover, the price action favors the bulls and suggests that the FXS price will continue to extend the bullishness.
Technical Levels
Support Levels: $9.20 and $9
Resistance Levels: $10.25 and $11
Disclaimer
The views and opinions stated by the author or any other person named in this article are for informational purposes only and do not constitute financial, investment, or other advice. Investing in or trading crypto or stocks comes with a risk of financial loss.

With a background in journalism, Ritika Sharma has worked with many reputed media firms focusing on general news such as politics and crime. She joined The Coin Republic as a reporter for crypto, and found a great passion for cryptocurrency, Web3, NFTs and other digital assets. She spends a lot of time researching and delving deeper into these concepts around the clock, and is a strong advocate for women in STEM.


