


The HIVE Crypto price prediction suggests the token produced an interesting inclining pattern. HIVE is trading above 20, 50, 100, and 200-day daily moving averages.
The HIVEUSD price prediction shows that the token is trying to break the upper trendline on the daily time frame chart. HIVE crypto needs to increase the positive momentum to break out from the upper resistance.
Nevertheless, sellers may approach upper levels acting as a resistance to the crypto price. However, the 24-hour trading volume is 3.279 Million.
HIVEUSD price prediction implies that investor sentiments regarding the HIVE token are bullish. Investors may prefer to keep a keen watch over the crypto. Presently, the HIVEUSD price is above all the key EMA and MA levels.
The present value of HIVE is $0.374238417. It has a market capitalization of around $187.199 Million with a fully diluted market cap of $187.199 Million. The crypto has a circulating supply of 500.749 Million.
HIVEUSD has performed decently so far this year. Year-over-year returns are 2.89% while returns over the past 6 months are 10.90%. The return was 2.54% last month and 1.55% last week. Technicals signal buying pressure while the technical oscillators indicate neutrality. The moving averages are also on the strong buy side. This shows bullish dominance in the market.
Technical Analysis of HIVE Crypto Price in 1-D Time Frame
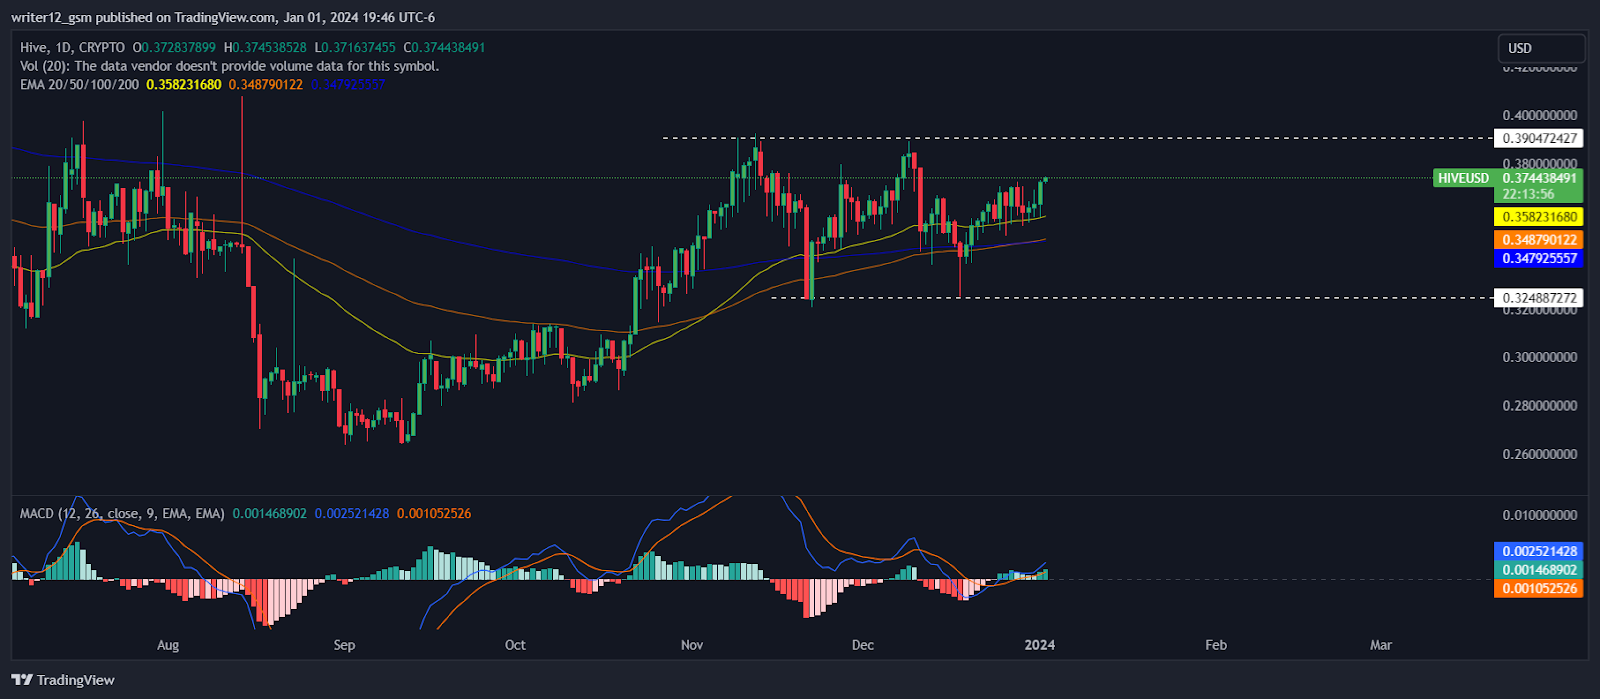
At the time of publishing, HIVE crypto (USD: HIVE) is trading above the 50 and 200-day daily moving averages (DMAs), which highlight bullish momentum.
However, if selling volume adds up, then the price might conquer supporting SMAs by making lower highs and lows. However, the HIVE price is expected to move upwards giving bullish views over the daily time frame chart.
The MACD line at 0.002473547 and the signal line at 0.001042950 are above the zero line. A bullish crossover is observed in the MACD which signals more strength for the HIVE crypto price.
The current value of RSI is 57.73 points. The 14 SMA is below the median line at 52.34 points which indicates that the HIVE crypto is bullish.
Summary
HIVE (USD: HIVE) technical oscillators also support the bullish trend. The MACD, RSI, and EMAs are emphasizing positive signs and imply that the uptrend may continue in the HIVE crypto price. HIVE price action suggests that the investors and traders are bullish on the 1-D time frame. The price action reflects a bullish perspective at the moment.
Technical Levels
Support Level: $0.324887272.
Resistance Levels: $0.390472427.


