



Stellar price prediction indicates that the Stellar crypto may see a further surge in its value within the next few months. Presently, the Stellar price is up by 1.18% over the past 7 days and according to the price action, it is facing bullish pressure.
At present, the bulls are in charge of the trend. They have maintained a firm command over the price action although the bears attempted to take control. Despite the bullish optimism, the buyers were unable to break through $0.134468, but they regained supremacy over the price action on the 1-day chart.
Stellar CRYPTO is trading above the key exponential moving averages within the bulls’ grasp. The price is facing resistance from the $0.134468 at present on the daily time frame. The price is facing substantial buying pressure in the supply zone which indicates that bulls may push its value up further shortly.
The technical indicators suggest that bulls hold the edge over the price action. The price pattern, oscillators, EMAs, and Volume are moving in tandem, giving similar signals. At the time of writing, XLM is trading at $0.132542 with an intraday gain of 0.44%, signaling bearishness. Moreover, the trading 24-hour volume is 64.103 Million.
Technical Analysis of Stellar Crypto Price in 1-D Time Frame
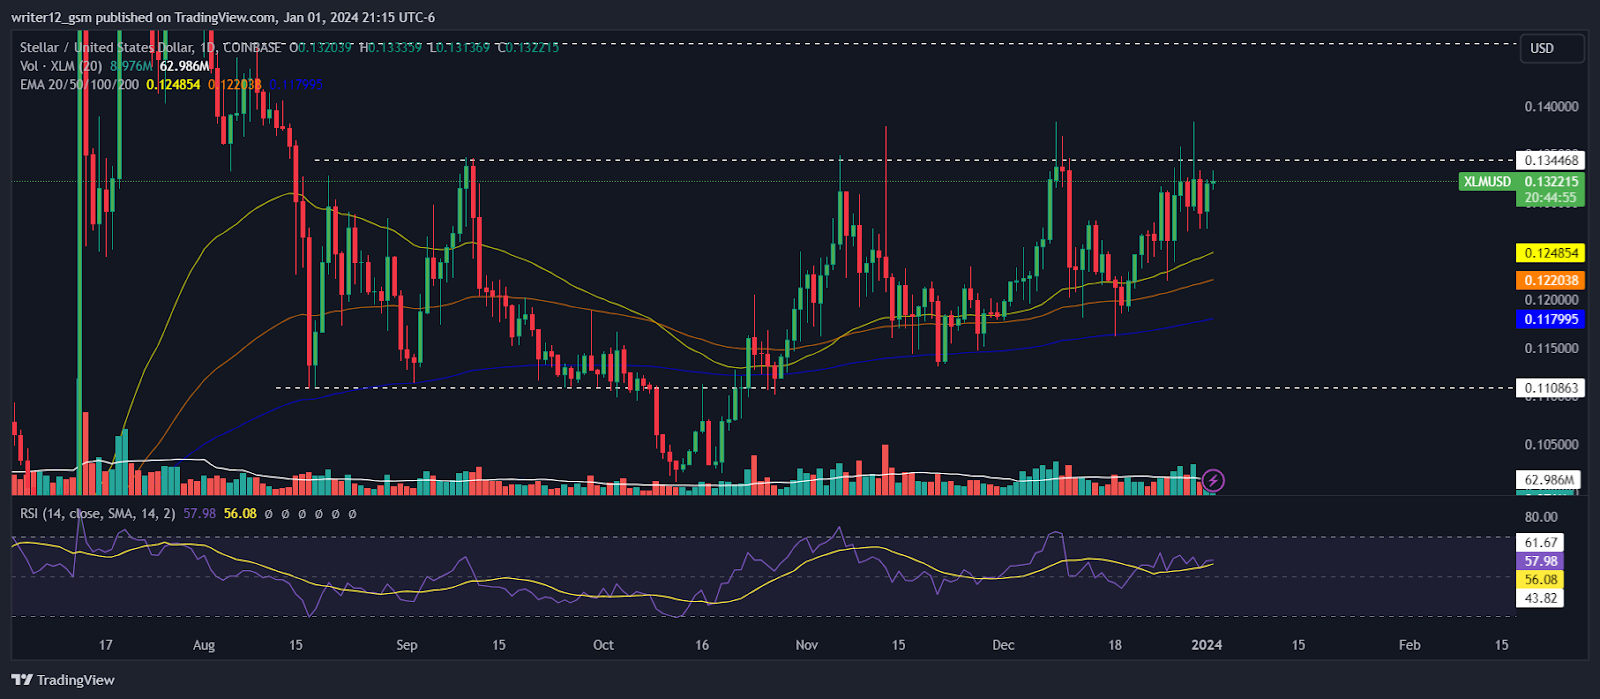
At the time of publishing, Stellar crypto (USD: XLM) is trading above the 50 and 200-day daily moving averages (DMAs), which are supporting the price trend.
Moreover, if the selling volume adds up, then the price might conquer supporting SMAs by making lower highs and lows. However, the XLM price is expected to move downwards giving bullish views over the daily time frame chart.
The current value of RSI is 58.03 points. The 14 SMA is above the median line at 56.08 points which indicates that the Stellar crypto is bullish.
The MACD line at 0.002245 and the signal line at 0.001822 are above the zero line. A bullish crossover is observed in the MACD indicator which signals more bullishness for the XLM crypto price.
Summary
Stellar (USD: XLM) technical oscillators support the bullish trend. The MACD, RSI, and EMAs are emphasizing positive signs and imply that the uptrend may continue in the XLM crypto price. Stellar price action suggests that the investors and traders are bullish on the 1-D time frame. The price action reflects a bullish perspective at the moment. The current scenario requires traders and investors to be patient and look for a clear break below or above the range before making any moves and avoid the fear of missing out to minimize losses.
Technical Levels
Support Level: $0.124857.
Resistance Levels: $0.134468.





