



The Bonk price is halted near the value of $0.0000350672 and keeps trading in the downward direction. The Bonk price is down by approximately 68% from the top price of $0.0000350672.
The price action of the BONK crypto showed that selling pressure was noted on the technical chart and was in a downtrend, forming lower lows over the past few months.
Moreover, due to profit booking, trading volume was below average. Furthermore, the BONK price action reflected negative sentiments in previous sessions.
The ongoing trend favors bears, and the crypto was also in a corrective phase, which made bulls cautious. Moreover, the BONK is trading below the significant moving averages and tried to touch the 100-day EMA.
At the time of writing, the BONK price was trading at $0.0000111555 with an intraday loss of 6.53%, highlighting bearishness. Moreover, the intraday trading volume is 107.239 Million and the market cap is $707.239 Million.
Year-to-date, the crypto registered -16.19% in returns and a phenomenal 3054.49% in the span of 6 months. In the last 1 month, it returned -47.61% and -24.97% in the last seven days, indicating profit booking in recent sessions.
Technical Analysis of BONK Crypto Price in 1-D Time Frame
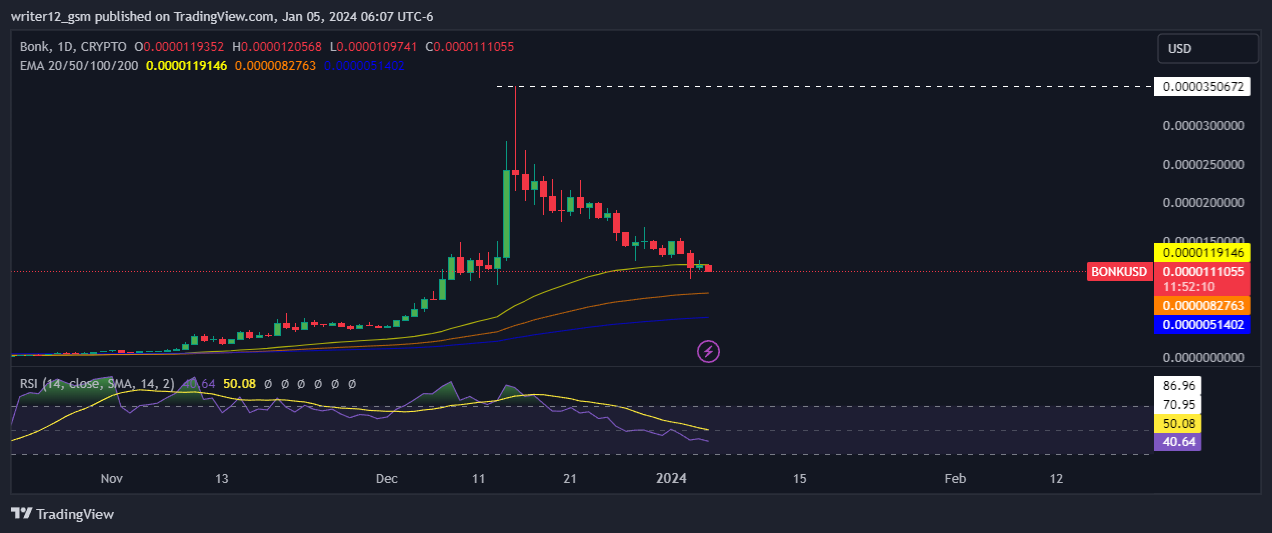
At the time of publishing, BONK crypto (USD: Bonk) is trading below the 20 and 50-day DMAs (Daily moving averages), which do not support the price trend. The current value of RSI is 40.66 points. The 14 DMA is above the median line at points which indicates that the BONK crypto is bearish.
The MACD line at 0.0000002585 and the signal line at 0.0000008387 are above the zero line. A bearish crossover is observed in the MACD indicator which signals more bearishness for the Bonk crypto price.
Bonk Price 4 Hour Time Frame Technical Evaluation
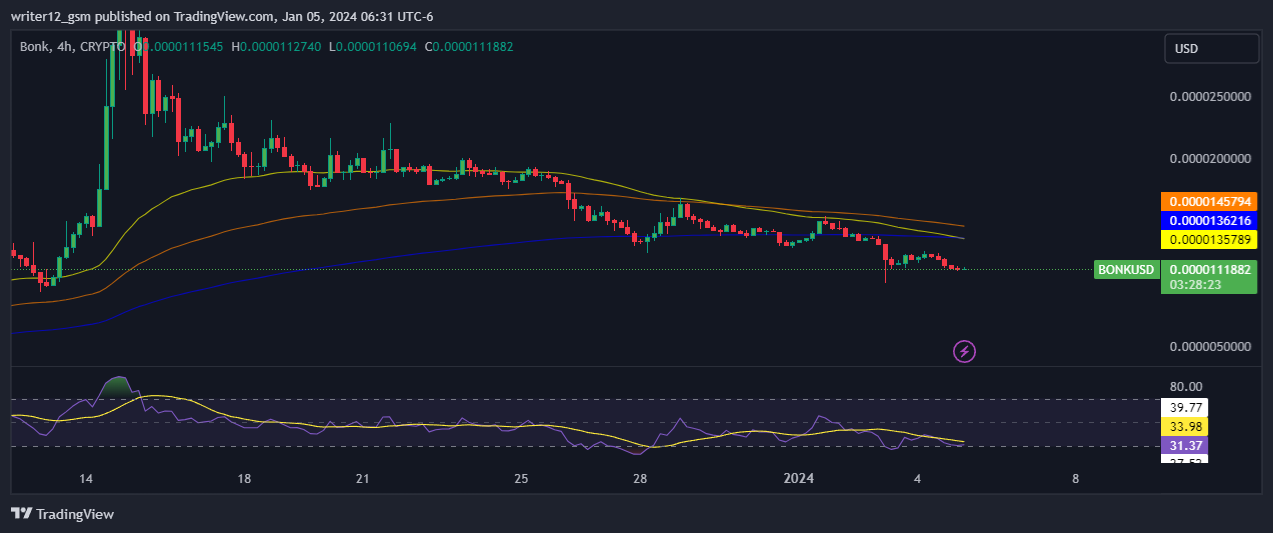
On the 4-hour chart, the BONK price is trading below the key moving averages showing bearishness.The RSI curve is near 31.70, below the neutral range, and showed bearishness on the short-term charts.
The MACD indicator still shows red bars on the histogram with a bearish crossover and did not signal any substantial upswing.
Summary
BONK crypto was under selling pressure on the technical charts. The crypto price is demonstrating weakness on both 1 day and 4 hour time frames. However, on the one day time frame, the crypto is still above the key moving averages while on the 4 hour chart, it broke below the key moving averages showing bearishness.
Technical Levels
Support Level: $0.0000082758.
Resistance Levels: $0.0000158309.





