


- Terra Classic crypto price is currently trading at $0.000120753 with a drop of 3.80% in the last 24 hours and a current market cap of $706.089 Million.
- Terra Classic crypto price decreased by 14.09% over the past seven days.
LUNC crypto price is facing strong bearish pressure on the daily technical chart. It is trading below the 20 and 50-day EMAs. The crypto has failed to break above its key resistance levels near the EMAs in the past few months, despite several attempts by bulls.
The crypto is currently trading near $0.000120753, with a marginal gain of 3.80% in the intraday session. The crypto has a potential upside target of $0.000192703, but it needs to overcome the bearish momentum and surge above the 200-day EMA. The crypto has a support level of $0.000106906, which could prevent further downside.
LUNC price prediction suggests that the crypto is in the firm grip of the bears. The technical indicators favor the bears, projecting a pessimistic perspective for the buyers. RSI and stochastic RSI oscillators are moving near the overbought zone whereas the major EMA lines act as barrier points for LUNC price.
The company’s performance could have been better throughout the year. It returned -12.87% in the year-to-date period, and 47.17% over the last six months, -44.45% last month, and 14.09% last week. This shows a persistent bearish trend that has not reversed yet.
Technical Analysis of LUNC Crypto Price in 1-D Time Frame
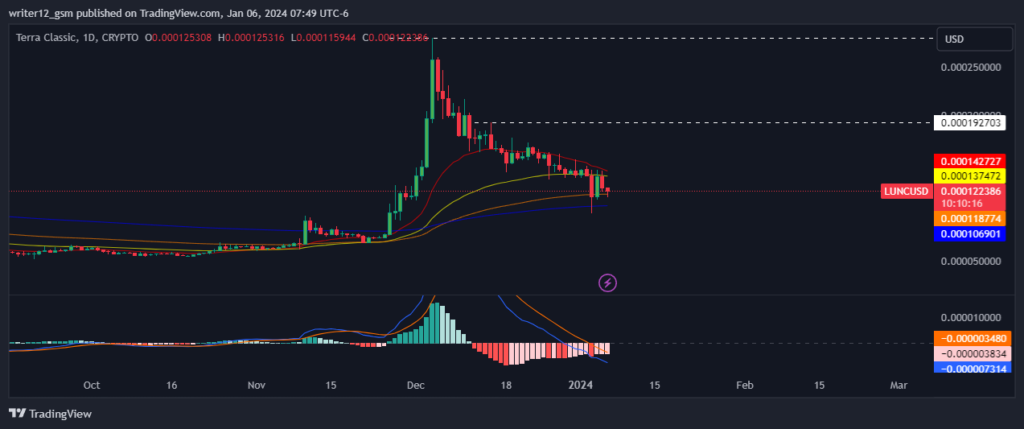
LUNC crypto (USD: LUNC) is trading under the 50 and 200-day daily moving averages (DMAs), which are not upholding the price trend.
The current value of RSI is 40.35 points. The 14 SMA is above the median line at 44.41 points which indicates that the LUNC cryptois bearish.
The MACD line is below the signal line heading downward. A bearish crossover is observed in the MACD indicator which signals more bearishness for the LUNC cryptoprice.
Weekly-Time Horizon Analysis LUNC Crypto
The weekly chart of LUNC crypto reveals that the sellers have been dominant. The crypto has been on a downward trend, as it is trying to break below the key EMAs. The technical indicators also confirm the bearish sentiment, as the RSI is near the oversold zone at 53 and the MACD has formed red bars and a bearish crossover. These signals indicate that the crypto may face more upside pressure in the coming weeks.
Summary
LUNC (USD: LUNC) technical oscillators reinforce the bearish trend. The MACD, RSI, and EMAs are emphasizing negative signs and suggest that a downtrend may occur in the LUNC crypto price chart. LUNC price action indicates that the investors and traders are bearish on the 1-D time frame. The price action reflects a bearish outlook at the moment.
Technical Levels
Support Levels $0.000192703
Resistance Levels: $0.000070479


