
 Home
Home News
News

- 1 AXS price showed a pullback from the 50-Day EMA in the last session.
- 2 AXS noted a retracement and has retested the support zone of $7.
AXS price showed a rejection from the top and retested the channel lows of $7 in the recent sessions. However, buyers succeeded in holding the gains, leading a smart recovery, and noted a hammer candlestick on the 50-Day EMA support zone. At present, AXS price is near the channel’s mid and is waiting for a follow-on buying momentum to carry forward the gains. Besides that, the Axie Infinity token has ended the correction and noted a recovery during the crypto market pump.
AXS price is trading close to the 20-Day EMA and is inside the rising parallel channel for the past sessions. However, the trend is intact, and buyers are eyeing to surpass the immediate hurdle of $10. Recently, profit booking was witnessed, and sellers have persisted in adding short positions, which led AXS price toward the 50-Day EMA zone.

At press time, Axie Infinity AXS) was trading at $8.16 with an intraday gain of 5.63%, showing a pullback and exhibiting neutrality. Moreover, the trading volume jumped by 19.80% to $63.69 Million, highlighting mixed sentiments. The pair of AXS/BTC was noted at 0.000184 BTC, while the market cap is $499.47 Million. Analysts have maintained a neutral rating and suggest that the AXS price will surpass $10 soon.
AXS on Daily Chart Displays Higher High Setup
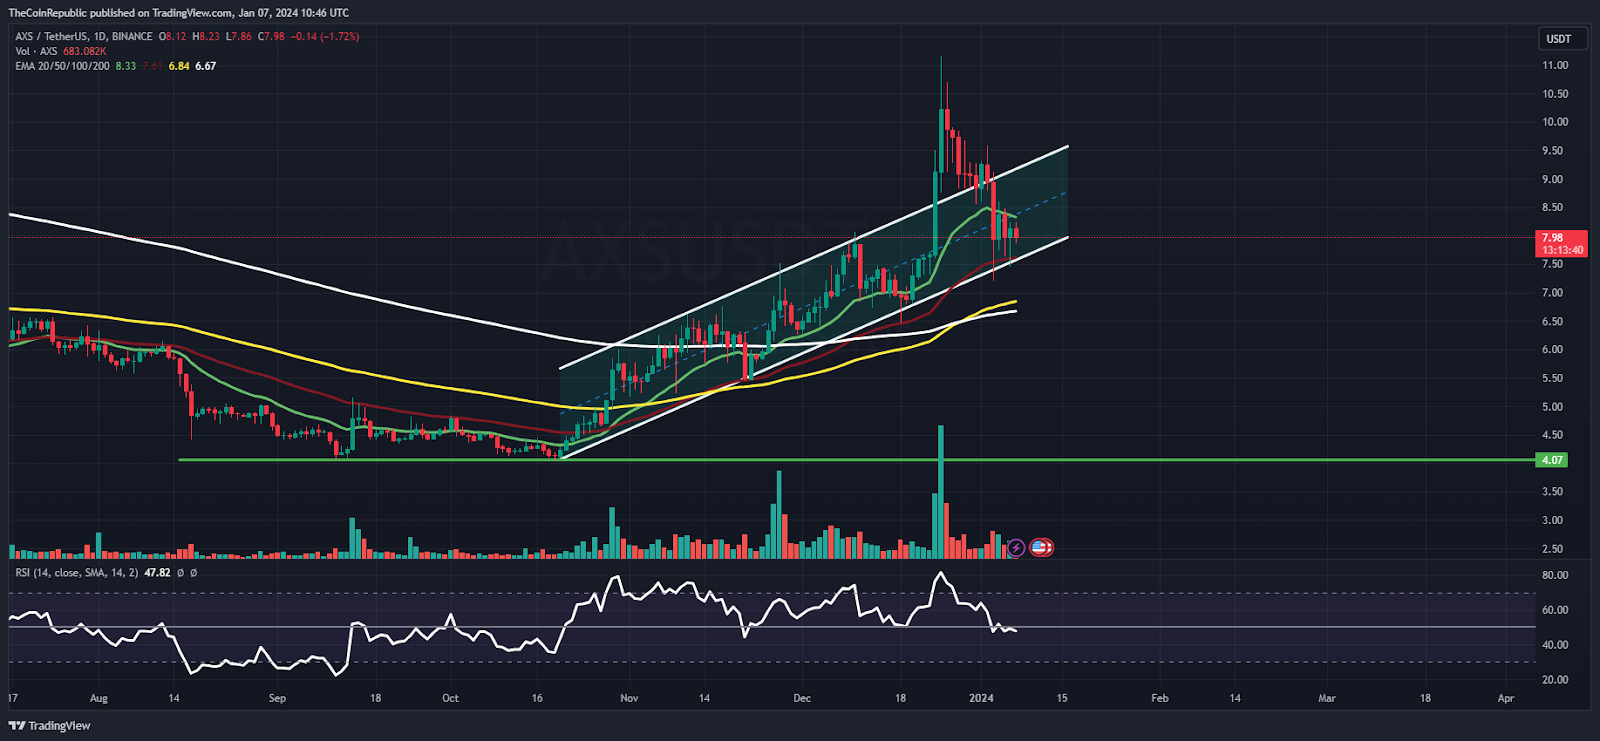
On the daily charts, AXS price showcased a sharp rejection from the supply zone of $11 and has retested the 50-day EMA mark near the channel lows. However, the trend is strong, and buyers are willing to surpass the immediate swing barrier of $9 to resume the fireworks.
The relative strength index (RSI) curve stayed at the midline, showcasing neutrality, and formed a positive divergence, suggesting a mixed signal. The MACD indicator showed a bearish crossover and formed red bars on the histogram, meaning that buyers are looking to attain momentum and targeting to surpass $10 soon.
Weekly Charts Exhibits Rejection From 50-Day EMA
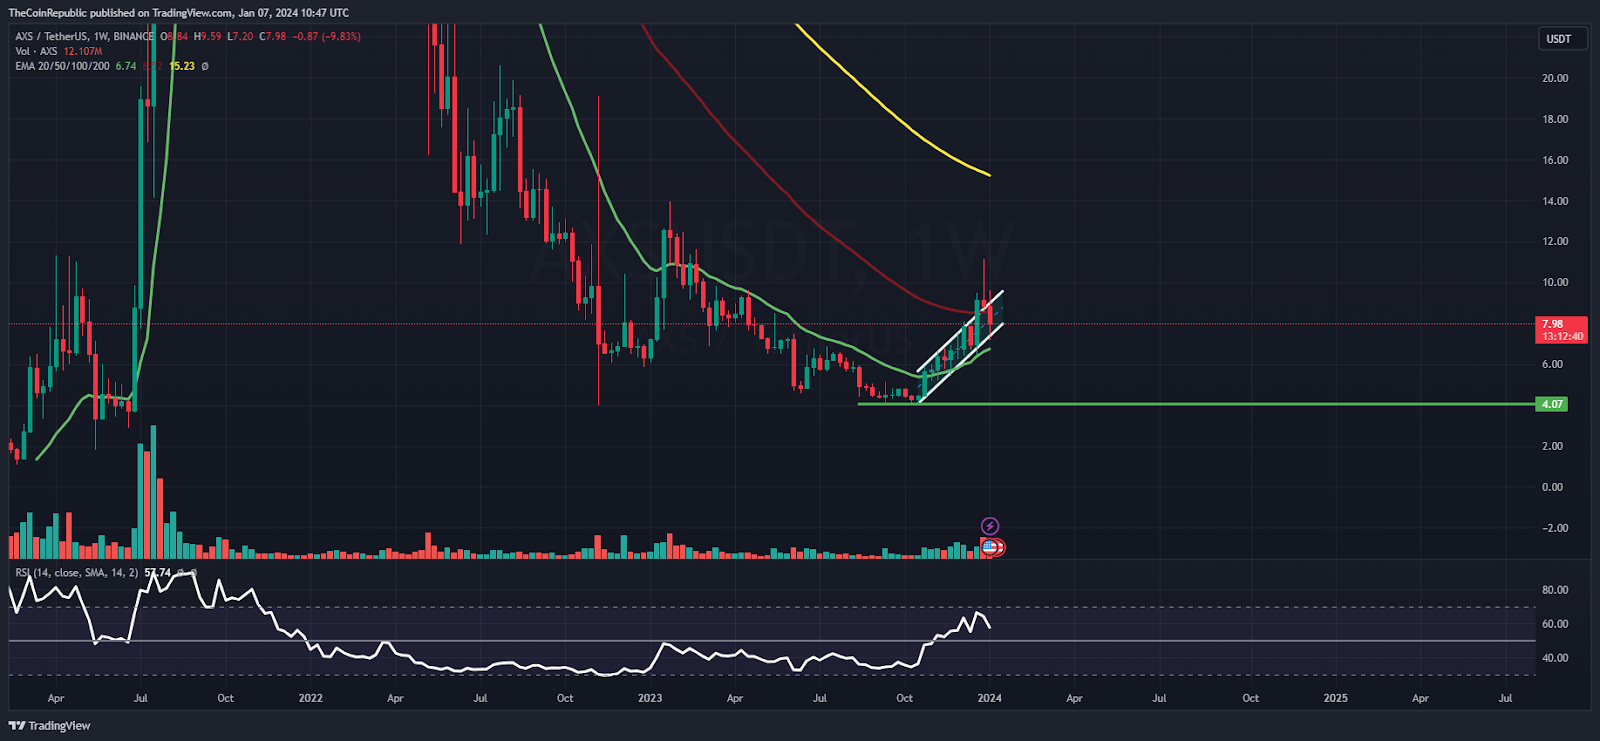
On the weekly chart, AXS price witnessed a double bottom pattern and is reversing the gains from the bottom zone of $4 and has recovered by over 80% in recent weeks. Afterward, buyers have continued to attain strength, lifting the gains and continuing to accumulate. Per the Fibonacci retracement zone, AXS price faced rejection from the 61.8% zone and has retested the 50% zone.
Summary
AXS price has recuperated from the lows and has retained the bullishness, delivering bullish momentum in the recent sessions. Moreover, the price action signifies the buyer accumulation and AXS price has taken support on the 50-Day EMA mark and is ready to climb above $10 soon.
Technical Levels
Support Levels: $7.50 and $6.70
Resistance Levels: $8.70 and $10
Disclaimer
The views and opinions stated by the author or any other person named in this article are for informational purposes only and do not constitute financial, investment, or other advice. Investing in or trading crypto or stocks comes with a risk of financial loss.

Nancy J. Allen is a crypto enthusiast, with a major in macroeconomics and minor in business statistics. She believes that cryptocurrencies inspire people to be their own banks, and step aside from traditional monetary exchange systems. She is also intrigued by blockchain technology and its functioning. She frequently researches, and posts content on the top altcoins, their theoretical working principles and technical price predictions.


