
 Home
Home News
News

- 1 RENQ price showcased a rejection from the 200-Day EMA mark.
- 2 Buyers have lost gains and are slipped below the 20-DayEMA support zone.
RENQ price has displayed a reversal and escaped the neckline of $0.010000, exhibiting a breakout of the double bottom formation. However, the buyers failed to stretch gains above the 200-day EMA and faced a sharp rejection. Afterward, RENQ price faced selling pressure as investors immediately booked profits.
RENQ price has slipped below the 20-Day EMA and is directing profit booking in the recent sessions. Moreover, the price action displays the long unwinding, and sellers are trying to deliver a selloff below the psychological round mark of $0.010000. Per the technicals, RENQ price will face selling pressure and may slip further below $0.009000 soon.

At press time, RENQ Finance (RENQ) is trading at $0.010043 with an intraday drop of 1.53%, showing an uptrend on the chart. Moreover, the trading volume jumped by 9.20% to $147, 078 highlighting buying momentum. The pair of RENQ/BTC was noted at 0.000000226 BTC, while the market cap is $10.08 Million. Analysts are bullish and suggest that RENQ price will face further volatility in the upcoming sessions.
RENQ on Daily Chart Reflects Rejection From 200-Day EMA
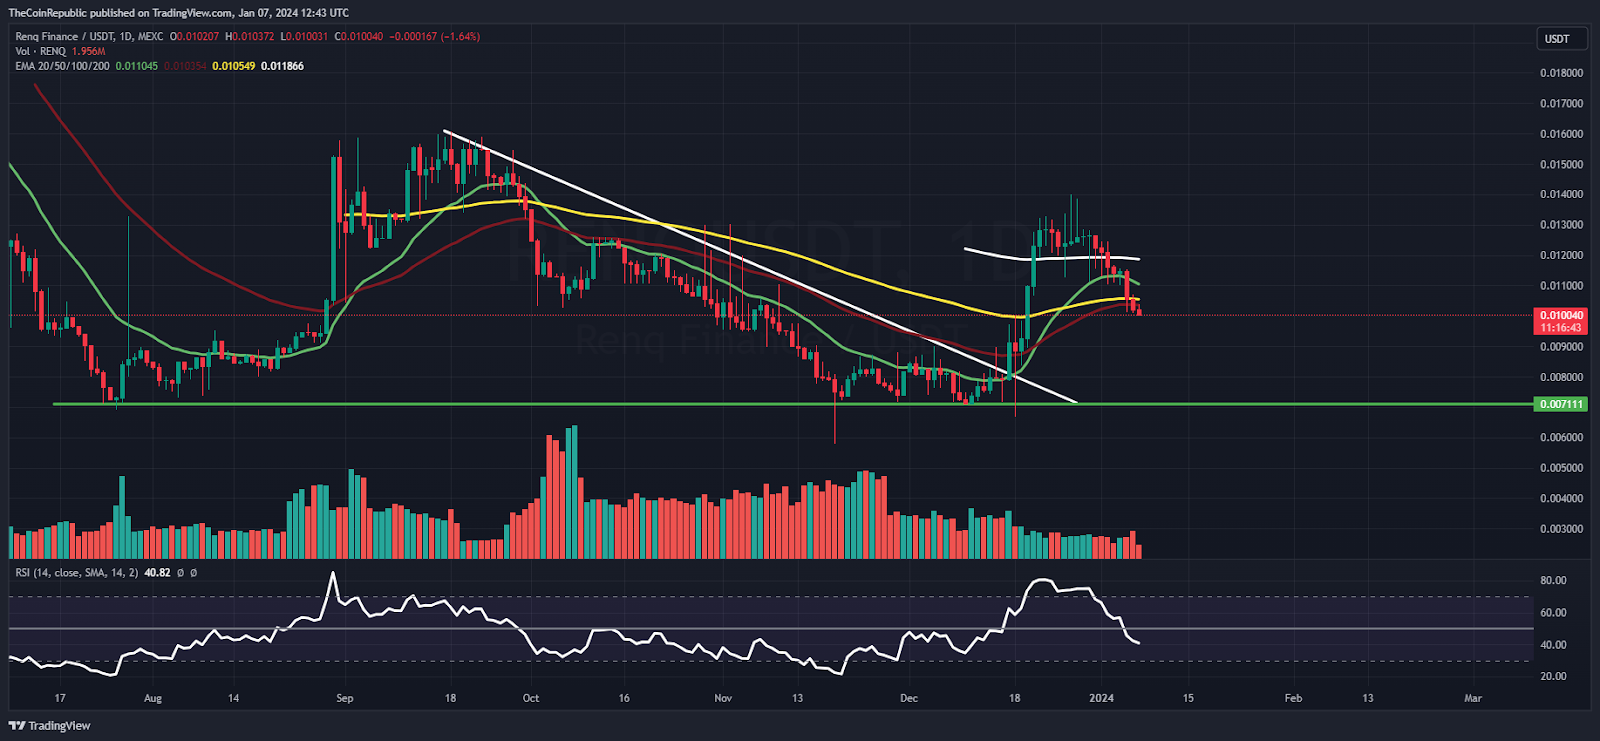
On the daily charts, RENQ price failed to sustain gains near the 200-Day EMA and exhibited a sharp rejection, which dragged RENQ below the 20-Day EMA. Additionally, the RENQ price will continue to drag gains and has retested the neckline of $0.010000. Per the Fibonacci retracement levels, the RENQ price has reverted from the 50% zone and is heading toward the 23.6% zone.
The relative strength index (RSI) curve stayed below the midline in the oversold region and displayed a negative crossover, replicating selling pressure on the charts. Moreover, the MACD indicator showed a bearish crossover and formed red bars on the histogram, suggesting that the RENQ price will deliver underperformance in the upcoming sessions.
RENQ on Weekly Chart Displays Bounce
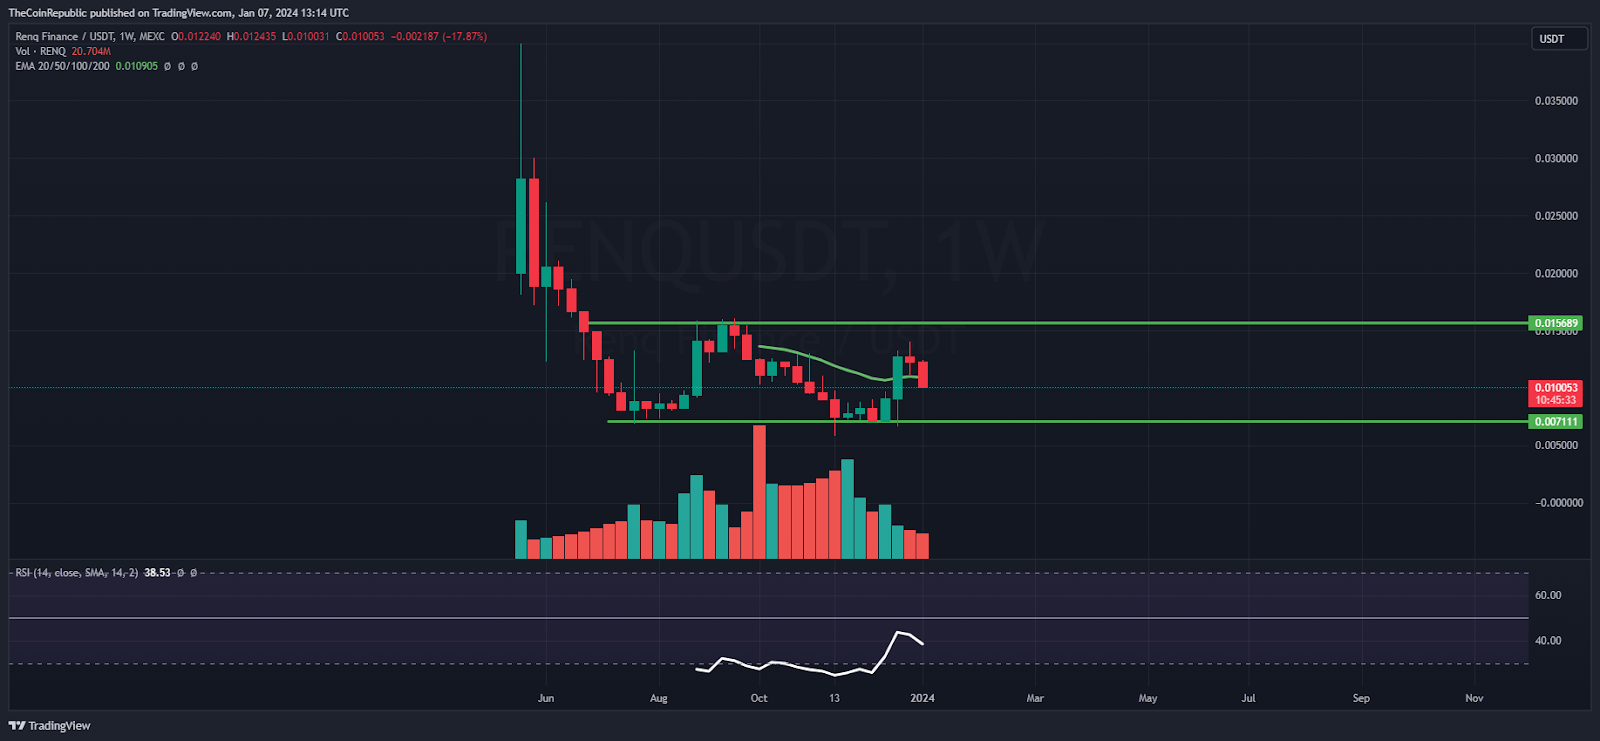
On the weekly chart, RENQ Finance displayed a classic W pattern and reverted its gains from the bottom zone of $0.007000 in recent sessions. Moreover, the technicals are reflecting that the RENQ price has retested the 20-Day EMA and formed a rejection candlestick.
Summary
RENQ price failed to sustain gains near the top and led to a sharp reversal from the 200-day EMA, resulting in slippage below the round mark of $0.01000. Additionally, the technical indicators are giving a sell alert, and the RENQ price may slip toward the prompt support zone of $0.009000 in the following sessions.
Technical Levels
Support Levels: $0.009000 and $0.008400
Resistance Levels: $0.01080 and $0.01190
Disclaimer
The views and opinions stated by the author or any other person named in this article are for informational purposes only and do not constitute financial, investment, or other advice. Investing in or trading crypto or stocks comes with a risk of financial loss.

With a background in journalism, Ritika Sharma has worked with many reputed media firms focusing on general news such as politics and crime. She joined The Coin Republic as a reporter for crypto, and found a great passion for cryptocurrency, Web3, NFTs and other digital assets. She spends a lot of time researching and delving deeper into these concepts around the clock, and is a strong advocate for women in STEM.


