
 Home
Home News
News
- 1 Arbitrum crypto price is currently trading at $1.7348 with a drop of 4.86% in the last 24 hours.
- 2 ARB has a current market cap of $2.221 Billion.
- 3 Arbitrum crypto is trading above the key moving averages showing strength on the charts.
Arbitrum price has halted near the value of $2.1157 and taking support on the value 20 EMA. However, the overall price is trending direction and has maintained an upward trend above the bullish zone. The chart shows current bullish momentum in the long term.
Moreover, the price action is favorable for buyers and the charts show continued growth activity. The price of Arbitrum is on an upward trajectory towards $2.1157, if it exceeds this the price will reach the new highs. Conversely, the lower trajectory is near $1.3003, a breakout of which will take the price back to the lower levels.
At press time, ARB was bearish, down by 4.86% intraday and trading at $1.7348. Moreover, the 24-hour trading volume is $982.82 million. However, the market capitalization of ARB is $2.221 Billion.
The ARB performance throughout the year was decent. It has had a positive return of 55.16% for the last 6 months, 52.80% for the past month, and 0.09% for the past week. It indicates a continuing bullish trend that has not yet been reversed.
Technical Breakdown of Arbitrum Crypto Price in 1-D Timeframe
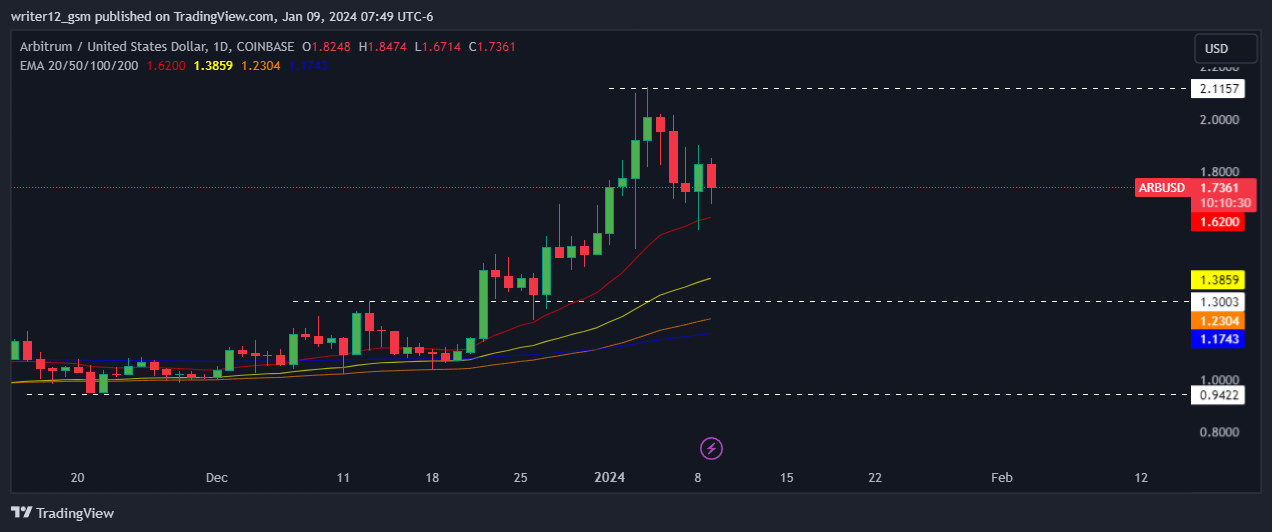
The Arbitrum (USD: ARB) cryptocurrency is currently trading above its 50-day and 200-day Daily moving average (DMA), which supports its price momentum. The current RSI value is 59.51 points. The 14 SMA is above the center line at 69.38 points, indicating the bullish nature of the Arbitrum cryptocurrency.
The MACD line at 0.1646 and the signal line at 0.1627 are above the zero line. There is a negative crossover in the MACD indicator, which indicates ineffective momentum in the price of the ARB cryptocurrency.
Analysis of Charts On the 4-hour chart
Arbitrum price is bullish and is hovering in the $2.1157-$1.3003 range at the highest volume. However, the trend is neutral and buyers are trying to break the zone and hold above the $2.00 level. The RSI curve is around 45, which is close to the neutral level, and price consolidation is forming a negative crossover, which contributes to the negative outlook on the chart. The MACD indicator has shown a neutral indicating neutrality. However, prices can be consolidated.
Summary
Technical of Arbitrum (USD: ARB) supports the bullish trend. MACD, RSI, and EMA highlight positive signals, suggesting that the upward trend in the price of the ARB cryptocurrency may continue. Price action suggests investors and traders are optimistic on a daily basis. Price movements reflect the current optimistic outlook. However, investors and traders must wait to be adequately ready for the next step and bypass FOMO.
Technical Levels
Support Levels: $1.3003
Resistance Levels: $2.1157.
Disclaimer
This article is for informational purposes only and does not provide any financial, investment, or other advice. The author or any people mentioned in this article are not responsible for any financial loss that may occur from investing in or trading. Please do your own research before making any financial decisions

Amanda Shinoy is one of the few women in the space invested knee-deep in crypto. An advocate for increasing the presence of women in crypto, she is known for her accurate technical analysis and price prediction of cryptocurrencies. Readers are often waiting for her opinion about the next rally. She is a finance expert with an MBA in finance. Quitting a corporate job at a leading financial institution, she now engages herself full-time into financial education for the general public.


