
 Home
Home News
News
- 1 Steller crypto price is currently trading at $0.117440 with a drop of 2.33% in the last 24 hours with a current market cap of $3.32 Million.
- 2 Steller’s crypto price decreased by 11.33% over the past seven days.
The price action of the Steller crypto indicated that selling pressure was noted on the charts and was in a downtrend, taking multiple rejections from the upper trendline. Moreover, due to declining investor interest, trading volume could have been higher.
The ongoing trend favors bears and the crypto was also in a corrective phase, which made buyers cautious. Moreover, the Steller crypto trades below the influential moving averages and tries to attain the 50-day EMA to hold the gains.
The Steller crypto also indicates a decrease in user activity, which also reacted as a negative sentiment for the crypto and led to bearishness in the charts.
This cryptocurrency has had a poor performance over the years. Year-to-date it gave negative returns of 9.10% and gained 17.56% in the last 6 months. In the last 1 month, it gave a negative return of 6.97% and 11.33% in the last seven days. It was indicating a long Bearish trend continuing till now.
Technical Analysis of Steller Crypto Price in 1-D Timeframe
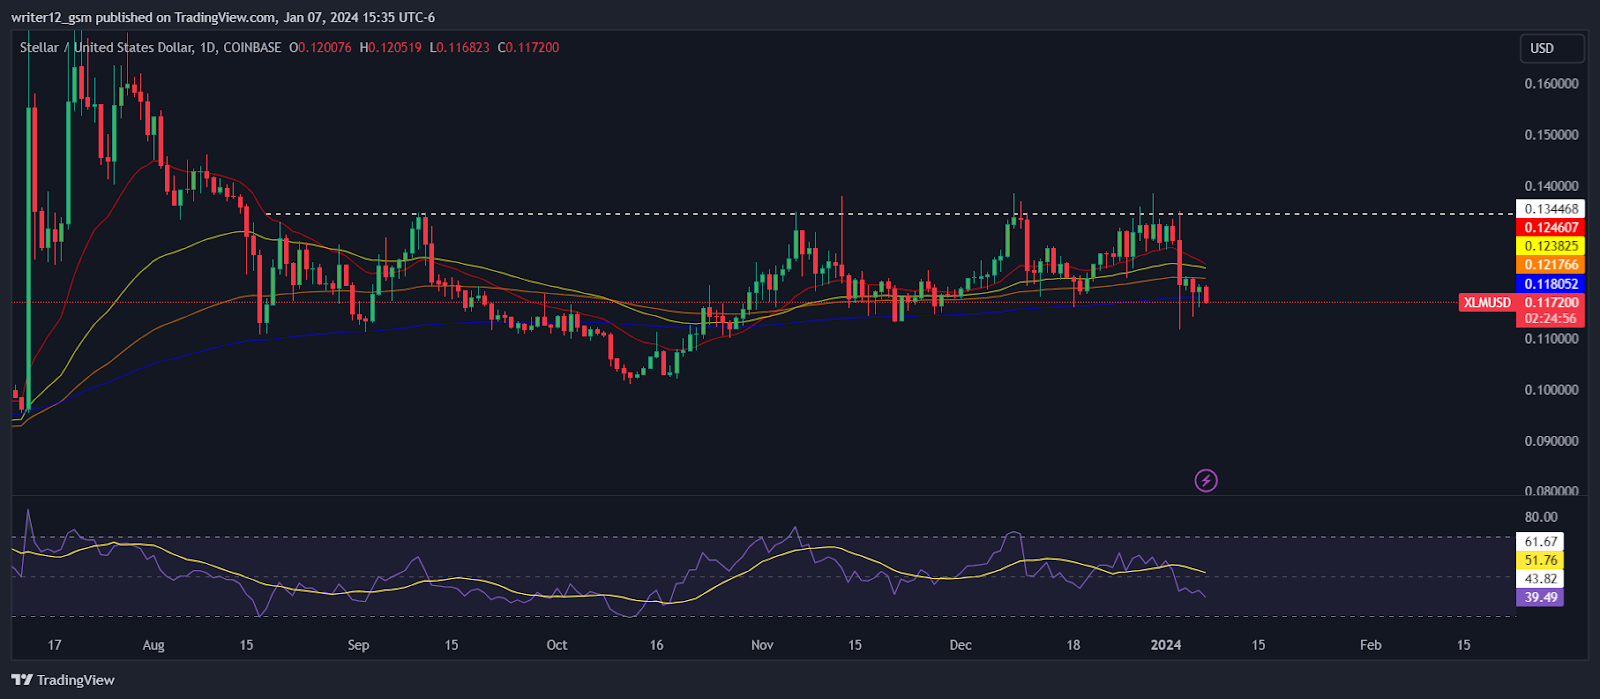
At the time of writing, the Steller price is trading at $ $0.117440 with an intraday drop of 2.33%, showing a bounce from the lower trendline near the support mark of $0.101027. Moreover, the intraday trading volume is 71.739 Million and the market cap is $3.323 Billion.
At the time of publishing, Steller crypto (USD: XLM) is trading below the 50-day and 200-day SMAs (Simple moving averages), which do not support the price trend.
The current value of RSI is 39.48 points. The 14 SMA is above the median line at 51.76 points, which indicates that the Steller crypto is bearish.
The MACD line at -0.001054 and the signal line at 0.000442 are above the zero line. A bearish crossover is observed in the MACD indicator, which signals more bearishness for the XLM crypto price.
4 Hour time frame Technical Evaluation
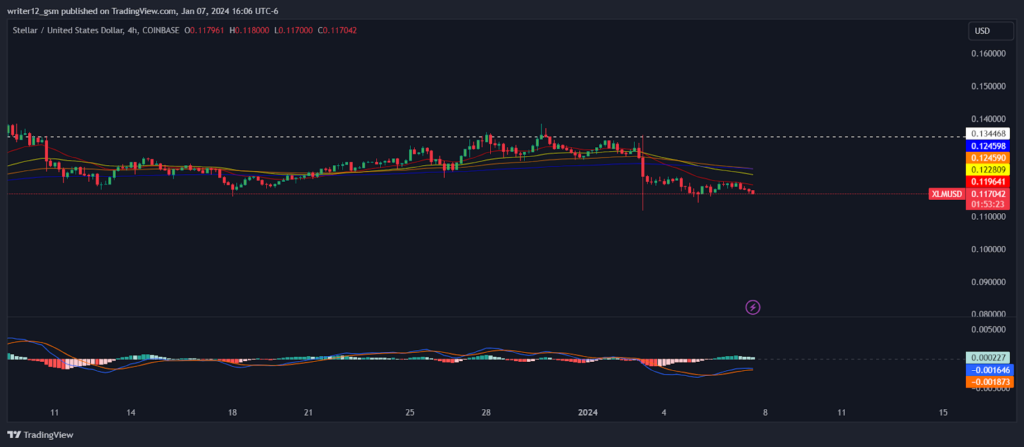
On the 4-hour charts, the Steller price is stuck in a narrow range and does not signal an upcoming rise because of low volume levels. Moreover, an essential indicator is still in the neutral zone and does not indicate bullishness.
The RSI line is close to 50, in the neutral territory, and showed a tight consolidation move on the short-term charts.
The MACD indicator still demonstrated green bars on the histogram with a buying crossover but did not indicate any substantial bullish move.
Summary
Steller (USD: XLM) technical oscillators maintain the downtrend. The MACD, RSI, and EMA are emphasizing unfavorable signs. It implies that the downtrend may continue in the XLM crypto price. Steller Price action suggests that the investors and traders are bearish on the 1-D time frame. The price action reflects a bearish standpoint at the moment.
Technical Levels
Support Levels: $0.112278.
Resistance Levels: $0.134468.
Disclaimer
This article is for informational purposes only and does not provide any financial, investment, or other advice. The author or any people mentioned in this article are not responsible for any financial loss that may occur from investing in or trading. Please do your own research before making any financial decisions

Adarsh Singh is a true connoisseur of Defi and Blockchain technologies, who left his job at a “Big 4” multinational finance firm to pursue crypto and NFT trading full-time. He has a strong background in finance, with MBA from a prestigious B-school. He delves deep into these innovative fields, unraveling their intricacies. Uncovering hidden gems, be it coins, tokens or NFTs, is his expertise. NFTs drive deep interest for him, and his creative analysis of NFTs opens up engaging narratives. He strives to bring decentralized digital assets accessible to the masses.


