
 Home
Home News
News
- 1 GAS price showcased a retracement and reached the 200-day EMA support mark.
- 2 Buyers failed to halt the gains and faced pressure from the top.
Gas is a token built on the NEO blockchain used to fuel the execution of smart contracts. All holders of NEO tokens automatically earn gas periodically. Despite the positive market sentiments, the price faced selling pressure and formed lower lows. The price has showcased a sharp correction and eroded over 58% of gains in the last three months signifying the sellers’ dominance.
GAS price is at a make-or-break zone near the 200-day EMA and is close to the channel lows of $5. However, a tweezer bottom candlestick was formed. Still, it needs a confirmation candle in the form of follow-on buying, which needs to surpass the swing barrier of $5.80 to initiate a rebound. Additionally, the trend is weak, and buyers did not manage to sustain the gains. The correction happens inside the falling wedge pattern, and the bear cartel looks aggressive and is eyeing to throw the GAS token below $5 in the following sessions.
At press time, GAS Token (GAS) is trading at $5.44 with an intraday gain of 2.30%, showing a downtrend on the chart. Moreover, the trading volume increased by 4.90% to $26.48 million, highlighting a pullback from the 200-day EMA mark. The pair of GAS/BTC was noted at 0.0000119 BTC, while the market cap is $523.69 Million. Analysts are bearish and suggest that the GAS price will continue to extend the down move and may break $5 soon.
GAS On Hourly Charts Displays Lower Tops And Lower Lows
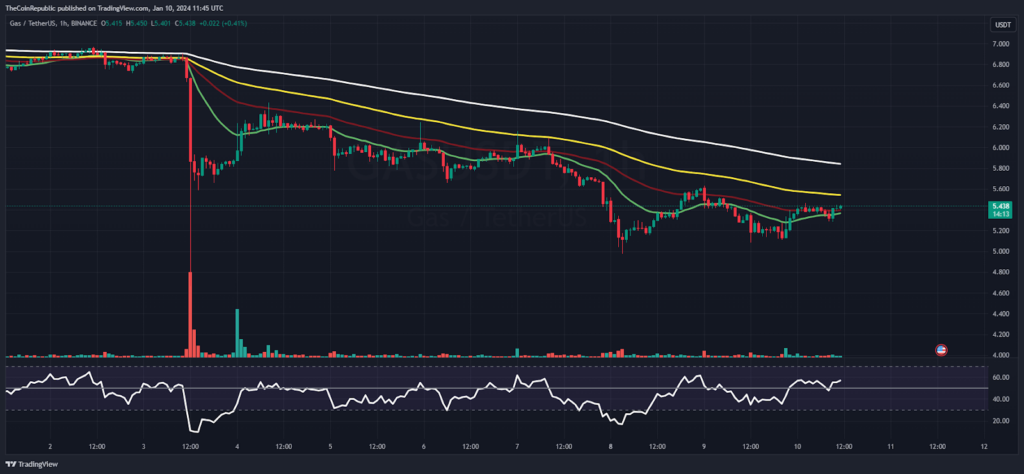
On the hourly charts, the GAS price is hovering near the 50-day EMA mark and is trying for a pullback to attain momentum. Amid the market positiveness, the GAS token did not impact and continued to drag the gains, which redirected the sellers’ dominance.
The Relative Strength Index (RSI) curve stayed close to the midline, showcasing a neutral projection on the chart. The MACD indicator showed a bearish crossover and formed red bars on the histogram, suggesting that the GAS token may continue to face selling pressure and will retest $5 soon.
GAS On Daily Charts Exhibits Falling Wedge Pattern
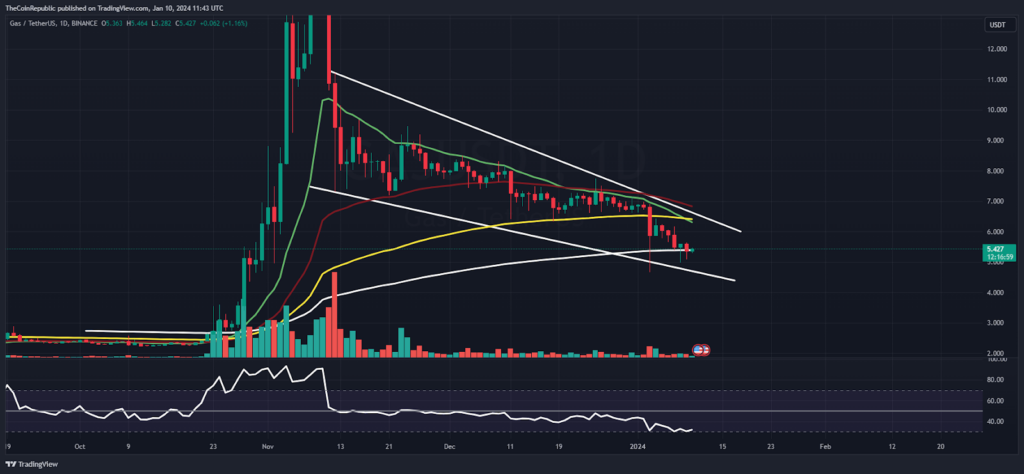
On the daily charts, GAS price has reverted its shine from the spot of $30 and displayed a long rejection wick. Afterward, a bearish engulfing candlestick was spotted, and the follow-on selling led GAS coin price toward its origin. Per the Fibonacci retracement levels, the GAS token is at the 23.6% support zone and is trying to halt the gains. If it slips below that, it will redirect to $4.60. If it rebounds, it will retest $6 in the following sessions.
Summary
GAS Token depicts a sharp rejection from the highs and is heading toward the lows, directing the bears’ dominance on the charts. Moreover, the trend is bearish, and further selling pressure may lead the GAS price below the 200-day EMA support zone and will fall below $5 soon.
Technical Levels
Support Levels: $5 and $4.60
Resistance Levels: $6 and $6.70
Disclaimer
The views and opinions stated by the author or any other person named in this article are for informational purposes only and do not constitute financial, investment, or other advice. Investing in or trading crypto or stocks comes with a risk of financial loss.

Amanda Shinoy is one of the few women in the space invested knee-deep in crypto. An advocate for increasing the presence of women in crypto, she is known for her accurate technical analysis and price prediction of cryptocurrencies. Readers are often waiting for her opinion about the next rally. She is a finance expert with an MBA in finance. Quitting a corporate job at a leading financial institution, she now engages herself full-time into financial education for the general public.


