
 Home
Home News
News
- 1 The RAY price is at $1.25 and it is displaying buying momentum in the intraday sessions.
- 2 The RAY token attained a pullback and witnessed an upward move of over 12%.
Raydium is built on the Solana blockchain, and it is an automated market maker (AMM) that leverages the central order book of the Serum decentralized exchange (DEX) to enable lightning-fast trades, shared liquidity, and new features for earning yields. The RAY token price showcased a retracement and took support from the 50-day EMA.
The RAY price showcased a bullish flag pattern and signaled a positive outlook for the following sessions. However, the ongoing profit booking led to a pause in the bullish rally, and sellers have been covering their positions in the recent sessions. Moreover, the price action shows that the Raydium price will gain momentum only if the price sustains gains above $1.50. Amid the positive market sentiments, the RAY price has recently surged over 280% and delivered a great performance for the past few sessions.

At press time, Raydium (RAY) trades at $1.25 with an intraday gain of 11.84%, showing a pullback on the chart. Moreover, the trading volume increased by 7.60% to $25.17 Million, highlighting investor interest. The pair of RAY/BTC was noted at 0.0000266 BTC, while the market cap is $467.88 Million. Analysts are bullish and suggest that the Raydium price will continue to extend its upward move and may cross $2 soon.
RAY On Daily Charts Displays Bullish Flag Pattern
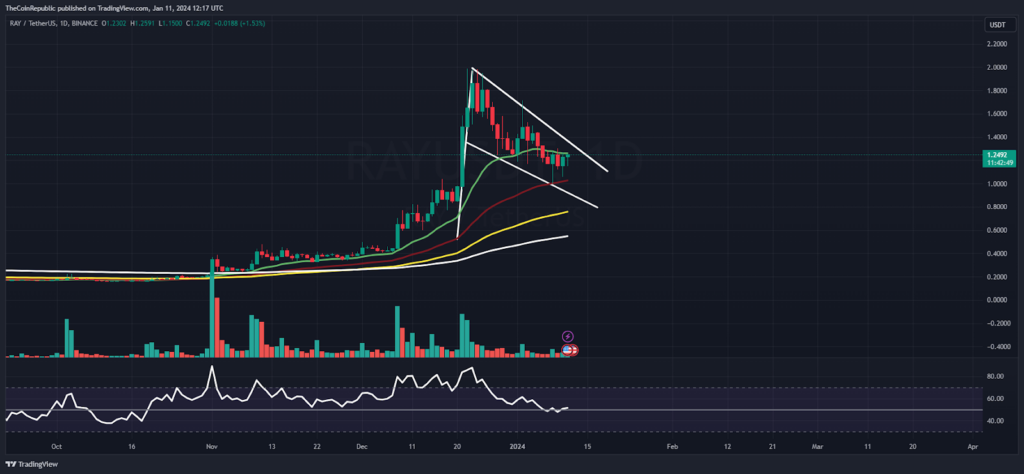
On the daily charts, the RAY price showcased an uptrend and glimpsed a healthy retracement. It may continue to make good gains amidst the rally in the crypto market and among its peers. Moreover, the technical indicators are also pointing to a buy signal and suggest that the RAY token may soar anytime and may breach its swing high of $2 soon.
The relative strength index (RSI) curve stays close to the midline and showcases a positive divergence, suggesting an upward move for the following sessions. The MACD indicator showed a bullish crossover and formed green bars on the histogram, suggesting that the bullish moves will carry forward soon and the RAY token will continue to deliver a great performance.
Weekly Charts Shows Rejection From 100 Day EMA
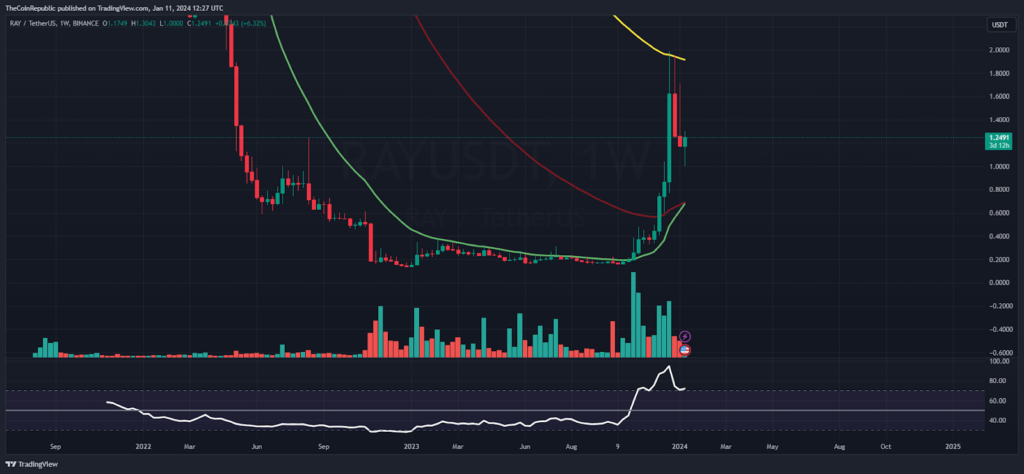
On the weekly charts, the Raydium token has gained a buying interest and soared over 500%. Additionally, the token underwent a correction and led a sharp comeback, gaining investor interest. Furthermore, the technicals are signaling the dominance of the bulls and buyers will continue to showcase their strength and will lift the price of RAY as high as possible.
Summary
The Raydium (RAY) price is showcasing a retracement and is pausing gains near the 50-day EMA, displaying a bullish flag formation. However, the trend is intact, and buyers will continue to uplift the gains and they are setting their eyes on breaching the $2 resistance level soon.
Technical Levels
Support Levels: $1.00 and $0.90
Resistance Levels: $1.50 and $2
Disclaimer
The views and opinions stated by the author or any other person named in this article are for informational purposes only and do not constitute financial, investment, or other advice. Investing in or trading crypto or stocks comes with a risk of financial loss.
Mr. Pratik chadhokar is an Indian Forex, Cryptocurrencies and Financial Market Advisor and analyst with a background in IT and Financial market Strategist. He specialises in market strategies and technical analysis and has spent over a year as a financial markets contributor and observer. He possesses strong technical analytical skills and is well known for his entertaining and informative analysis of the Financial markets.


