
 Home
Home News
News

- 1 The EMAs are behaving as dynamic support and resistance levels. The sellers are clearly dominant.
- 2 The price of FTM is in a downtrend, making lower highs and lower lows structures on the chart.
Fantom is a platform that avails a DAG smart contract platform to provide DeFi services to creators using its unique consensus algorithm.
With FTM, Fantom wants to solve issues related to smart-contract platforms, especially transaction speed, which developers claim they have reduced to less than two seconds.

Fantom is a Layer-1 blockchain that uses a new consensus mechanism and a distinct consensus layer, Lachesis, to support DeFi and related services based on smart contracts.
Fantom objects to use a new consensus mechanism to aid DeFi and related services centered on smart contracts.
The mechanism, Lachesis, delivers much higher throughput and two-second transaction finality, along with improvements to security over traditional PoS algorithm-based platforms.
Fantom uses a specific type of PoS algorithm to offer services and secure its network. Known as Lachesis, it is an instance of an aBFT consensus mechanism.
A Closer Look on Fantom Crypto Price Chart (Daily Time Frame)
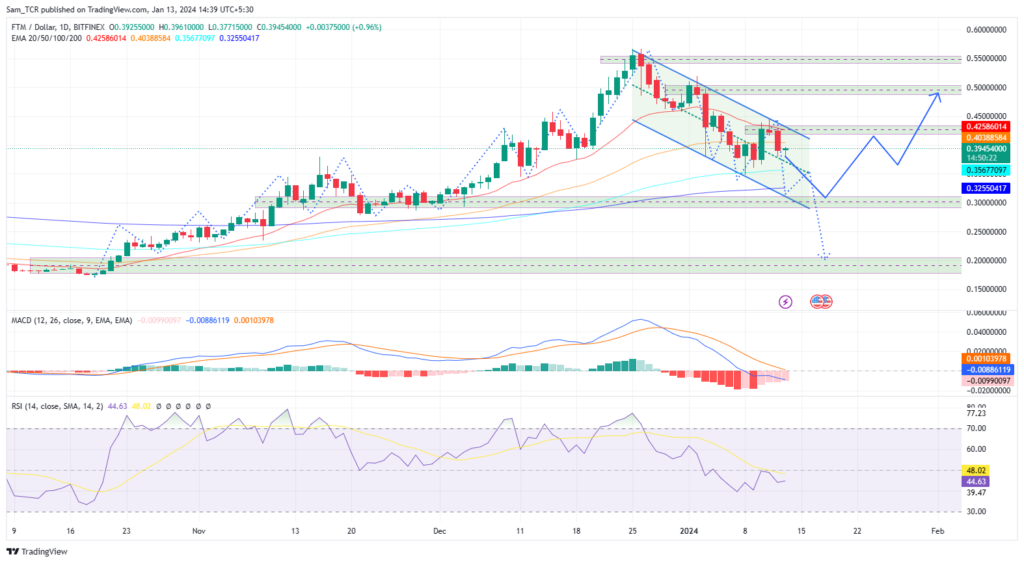
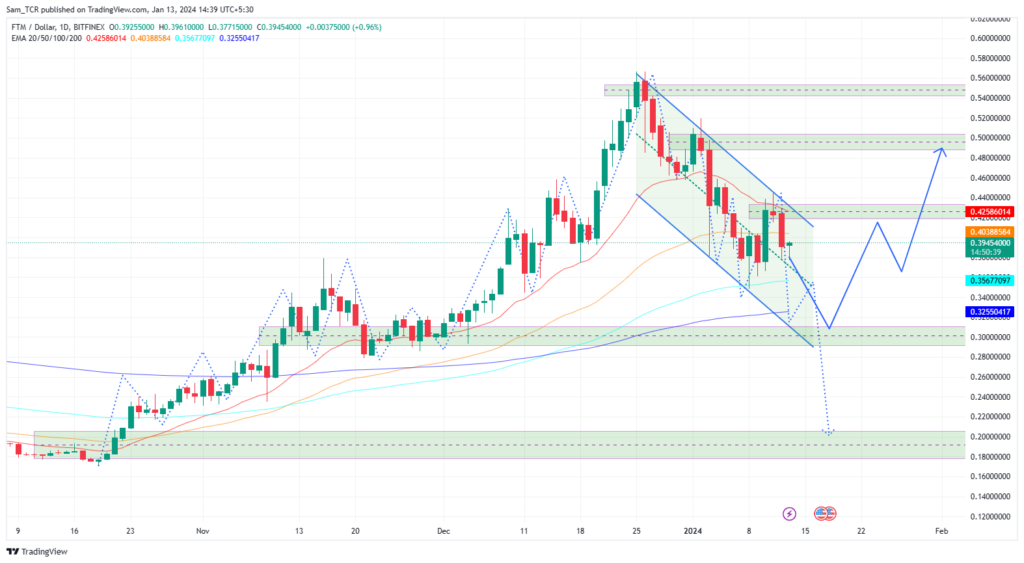
The Fantom price is below the 20, and 50-Day exponential moving averages, hovering above 100, and 200-Day EMAs. These EMAs are behaving as dynamic support and resistance levels, highlighting the sellers’ dominance, which could possibly push the price down, and smash higher EMAs.
The Fantom crypto asset is presenting bearish characteristics and can be reduced more. Last week if recorded a 7.34% drop, implying a strong downward trend. Also, the price has been in a downward parallel channel since the last week of December 2023.
The price of FTM is in a downtrend, making lower highs and lower lows structure on the chart. The CMP of Fantom is $0.392550 with a 24-hour intraday volume of 95.829 Million.
Therefore, if the FTM price breaks below the immediate support level, it could fall further to $0.30000, which is the next possible support level, and if that breaks then the last line of defense will be $0.20000.
On the other hand, if the Fantom crypto price reverses the trend and breaks above the EMAs, it could rise to $0.48500, which is the next possible resistance level.
The FTM asset is exhibiting bearish weakness as the MACD is showing a bearish cross and the RSI is below 50, implying that the crypto asset is still in negative territory and can sink further down.
Summary
The FTM price is below the 20, and 50-Day EMAs, and is hovering above the 100, and 200-Day EMAs. These EMAs are behaving as dynamic support and resistance levels. Sellers are dominating and could push the price down, and smash through EMAs.
Therefore, if the FTM price breaks below the immediate support level, it could fall further to $0.30000, which is the next possible support level, and if that breaks then the last line of defense will be $0.20000.
Technical Levels
Support Levels: $0.30000
Resistance Levels: $0.48500
Disclaimer
In this article, the views, and opinions stated by the author, or any people named are for informational purposes only, and they don’t establish the investment, financial, or any other advice. Trading or investing in cryptocurrency assets comes with a risk of financial loss.

With a background in journalism, Ritika Sharma has worked with many reputed media firms focusing on general news such as politics and crime. She joined The Coin Republic as a reporter for crypto, and found a great passion for cryptocurrency, Web3, NFTs and other digital assets. She spends a lot of time researching and delving deeper into these concepts around the clock, and is a strong advocate for women in STEM.


