
 Home
Home News
News
- 1 The Bonk price is above the key moving averages, demonstrating the bullishness on the chart.
- 2 The Bonk crypto price forecast demonstrates neutrality on the charts for January 2024.
The Bonk price forecast is demonstrating neutrality on the chart as bears and bulls are both trying hard to control the price on the daily timeframe.
Recently, the sellers tried to bring down the crypto price to break below the 50-day moving average, but they failed as the buyers are accumulating the crypto at the lower levels and took the price above the 50-day moving average. However, the bulls and the bears do not have a proper grasp of the trend.
As per TradingView, the current price of the Bonk crypto is at the level of $0.0000140598 with an intraday loss of approximately 1.10%. The 24-hour trading volume of the coin is 191.847 Million and the market cap of the coin is $890.735 Million.
Moreover, the performance of the coin is outstanding as it gave an unbelievable return of 3910.32% in the last 6 months, and in the last 3 months, it grew by 7064.65%. However, the BONK price has experienced a mild weakness in recent times.
According to the technical summary on TradingView, out of 25 indicators, 5 are on the sell side, 9 are on the neutral side and 11 are on the buy side which shows that the indicators are giving buying signals and indicating a positive outlook for the BONK price.
Will Bonk Price Sustain the Bullish Momentum or Crash Down?
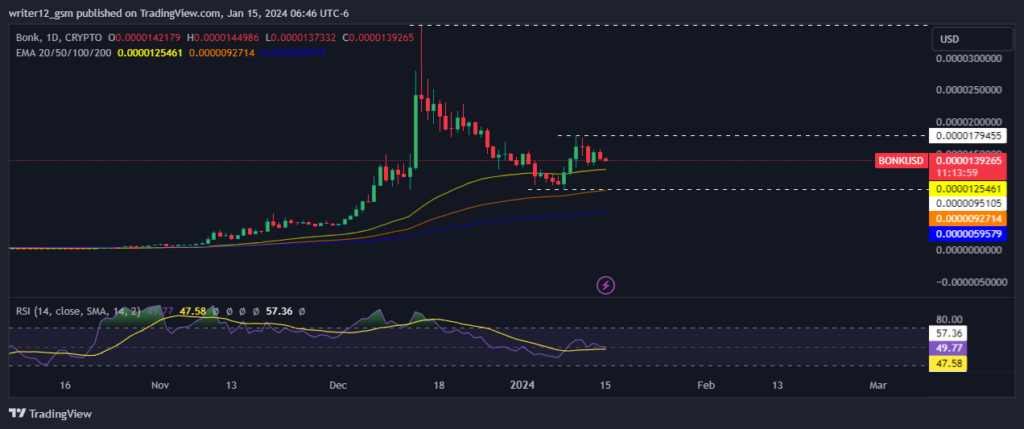
On the daily time frame, the BONK price is above the major EMAs of the 50, 100, and 200-day EMAs, demonstrating the presence of bulls.
The key indicator RSI is showing a neutral perspective on the daily chart as it is at the level of 49.98 while the 14 SMA is trading at 47.59.
The MACD is consolidating near the zero line and indicating a neutrality in trend. Moreover, the price is hovering near the middle Bollinger band and demonstrating neutrality.
Overall, the technical indicators demonstrate neutrality on the daily time frame. If the price wants to smash the higher levels and bounce back, it needs an influx of buyers.
If the price sustains at the current levels, it might reach the upper levels in the upcoming sessions. On the other hand, if the price is unable to sustain above the key moving averages and breaks below it, then it might fall to lower levels.
The investors and the traders should wait for the proper direction of the price to be confirmed before taking the next move.
Summary
The BONK price prediction suggests that bears and bulls have not yet fully understood the trend. Investors may prefer to wait for multiple technical indicators to converge to determine the trend direction. The green candle is slightly increasing, indicating that the Bonk price is attracting buyers in the demand zone.
Technical Levels
Support Levels: The most immediate support levels for the BONK crypto price are $0.0000095105.
Resistance levels: The most immediate resistance levels for the Bonk crypto price are $0.0000179455.
Disclaimer
The analysis provided in this article is for informational and educational purposes only. Do not rely on this information as financial, investment, or trading advice. Investing and trading in crypto involves risk. Please assess your situation and risk tolerance before making any investment decisions.

Amanda Shinoy is one of the few women in the space invested knee-deep in crypto. An advocate for increasing the presence of women in crypto, she is known for her accurate technical analysis and price prediction of cryptocurrencies. Readers are often waiting for her opinion about the next rally. She is a finance expert with an MBA in finance. Quitting a corporate job at a leading financial institution, she now engages herself full-time into financial education for the general public.


