
 Home
Home News
News
- 1 The Polkadot price forecast points to a mild correction phase in the price for January 2024.
- 2 The DOT price is taking support from the 50-Day moving average, showcasing that the trend is still bullish.
- 3 The Polkadot price declined by 1.00% in the previous 24 hours, showcasing bearishness on the daily timeframe.
The Polkadot price forecast for January 2024 points to a mild correction for the DOT price, which halted near the value of $9.60 and is now taking support from the 50-day EMA.
However, the trend is still bullish as the price is above the key moving averages and the bulls are supporting the price at the lower levels. Buyers are still accumulating the crypto at the lower levels, demonstrating their presence.

Moreover, the price action is advantageous for buyers and the charts show continued growth movement. The price of Polkadot is on an upward trajectory towards $8.50, and if it surpasses this level, the price will return to the high of $10.00. Conversely, the lower trajectory is near $7.18, a breakdown of which will take the price back to the 200-day EMA near $5.50.
At press time, DOT was bearish, down 1.00% intraday and trading at $7.56. Moreover, the 24-hour trading volume is $181.403 million. The market capitalization of DOT is $9.557 Billion.
The crypto’s performance throughout the year was decent. It gave a positive return of 25.04% in the last year. It gave a remarkable return of 45.56% in the span of the 6 months and a return of 99.47% in three months. Furthermore, it gained by 8.05% in the last month. In this week, it grew from the lower support level and gained by approximately 9.28%, demonstrating the bulls’ presence.
Technical Analysis of Polkadot Crypto Price
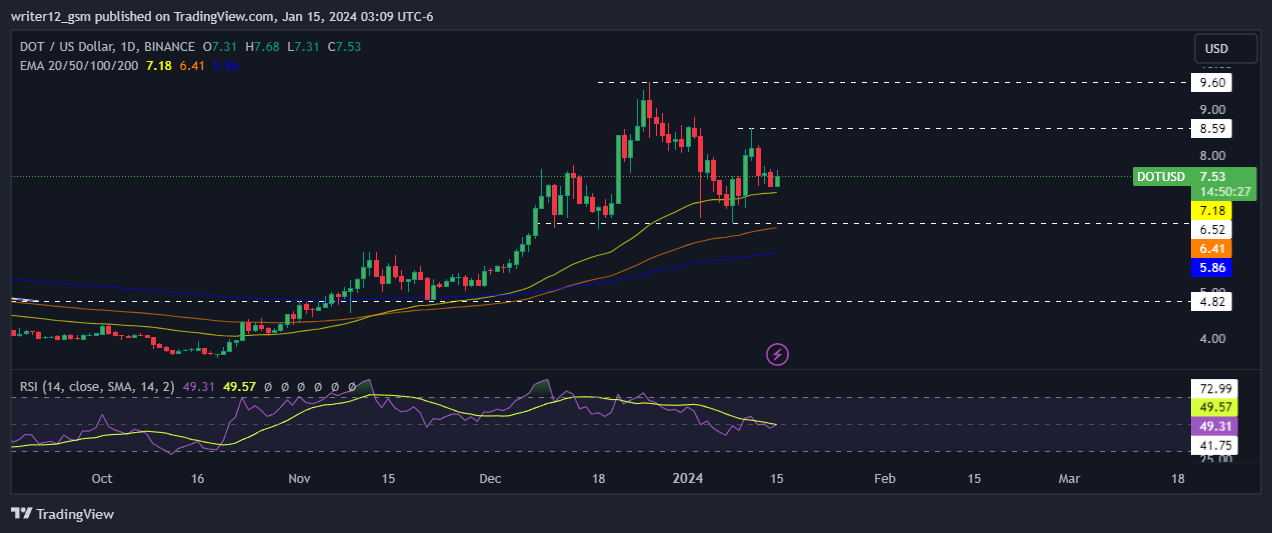
The Polkadot (USD: DOT) cryptocurrency is currently trading above its 50-day and 200-day daily moving averages (DMAs), which supports its price momentum. The current RSI value is 49.41 points. The 14 SMA is above the center line at 49.57 points, indicating the neutral nature of the Polkadot cryptocurrency.
The MACD line at 0.02 and the signal line at 0.11 are above the zero line. There is a bearish crossover in the MACD indicator, which showcases weak momentum in the price of the DOT cryptocurrency.
Summary
Technical oscillators for Polkadot (USD: DOT) support the bullish trend in the long term. The MACD, RSI, and the EMAs highlight neutral signals, suggesting that the upward trend in the price of the DOT cryptocurrency may continue. The price action suggests that investors and traders are optimistic on a daily timeframe. The price movements reflect the current positive outlook. However, investors and traders must wait to be properly prepared for the next step and avoid FOMO while making any move.
Technical Levels
Support Levels: $7.00.
Resistance Levels: $8.59.
Disclaimer
This article is for informational purposes only and does not provide any financial, investment, or other advice. The author or any people mentioned in this article are not responsible for any financial loss that may occur from investing in or trading. Please do your own research before making any financial decisions
Steve Anderson is an Australian crypto enthusiast. He is a specialist in management and trading for over 5 years. Steve has worked as a crypto trader, he loves learning about decentralisation, understanding the true potential of the blockchain.


