
 Home
Home News
News

- 1 The Ethereum price is trading above the key moving averages showcasing bullishness on the daily chart.
- 2 ETH price is showing the bulls’ dominance on the daily timeframe.
Ethereum price is in bullish momentum, showcasing bullishness on the daily timeframe. The price is trading above the key moving averages showing the buyer’s dominance over the sellers.

The buyer keeping the ETH price on the top and is not in the mood to lose momentum as of now. The price is heading towards the upper level of $2700 by making higher high structures.

At the time of writing, ETH is trading at the level of 2527.3 with an intraday increase of 0.66%. The 24-hour volume of crypto is 8.822 Billion. Ethereum has a market capitalization of 303.408 Billion.
Ethereum crypto price has seen a slight increase of about 8.20% over the past week and a modest gain of 13.36% over the past month. However, the crypto has also performed well over the longer term, as it has risen by about 61.31% over the past three months, and by about 33.69% over the past six months.
The crypto’s performance throughout the year has also been decent, with a year-to-date incline of about 10.63% and a remarkable return of 62.55% over last year.
Technical Analysis of the Ethereum on the Daily Time Frame
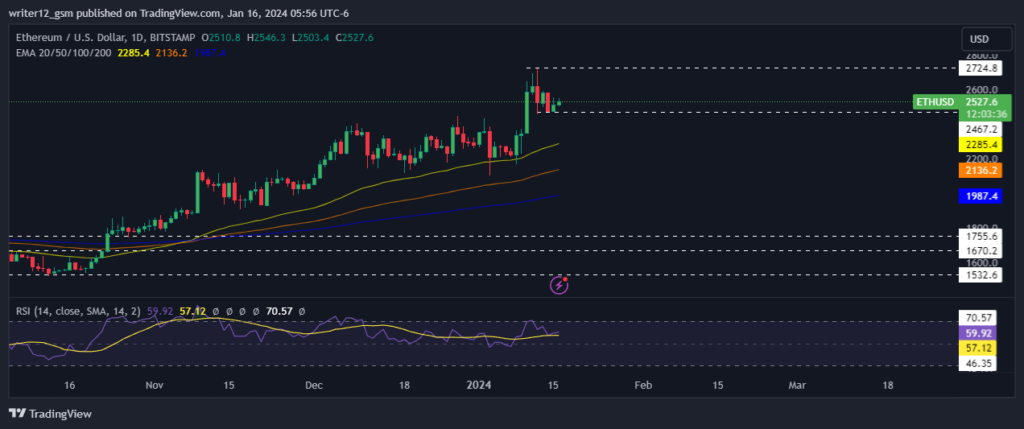
Ethereum Crypto showed buyers strength On the daily time frame chart. Moreover, the price is trading above the major EMA, indicating further strength for the cryptocurrency.
The RSI curve is near the overbought zone, with a positive outlook indicating bullish sentiment in the cryptocurrency. The MACD indicator also continued to form a green band and a bullish crossover appeared, indicating a bullish move in the upcoming days.
The RSI curve is hovering at the level of 60, demonstrating the buyers have an edge over the sellers. Moreover, the 14 SMA line is also trading near the overbought zone showcasing buyers’ dominance.
The MACD is trading in the bullish territory with a bearish cross and the green bars on the histogram showcasing the bulls are in the power over the bears.
Summary
Ethereum (USD: ETH) technical oscillators support the bullish trend. The MACD, RSI, and EMA are highlighting pessimistic signs and imply that the uptrend might continue in the ETH price. The Ethereum Price action indicates that the investors and traders are bullish on the 1-D time frame.
The price action recalls a bullish standpoint at the moment. Moreover, Ethereum investors avoid the fear of missing out. Scarcity is constructed in the crypto market to acquire more investors and creditors. It is better to keep it at arm’s length as this may result in one of the emerging reasons for market volatility.
Technical Levels
Support Levels: $2467.20.
Resistance Levels: $2724.80.
Disclaimer
This article is for informational purposes only and does not provide any financial, investment, or other advice. The author or any people mentioned in this article are not responsible for any financial loss that may occur from investing in or trading. Please do your own research before making any financial decisions

With a background in journalism, Ritika Sharma has worked with many reputed media firms focusing on general news such as politics and crime. She joined The Coin Republic as a reporter for crypto, and found a great passion for cryptocurrency, Web3, NFTs and other digital assets. She spends a lot of time researching and delving deeper into these concepts around the clock, and is a strong advocate for women in STEM.


