
 Home
Home News
News
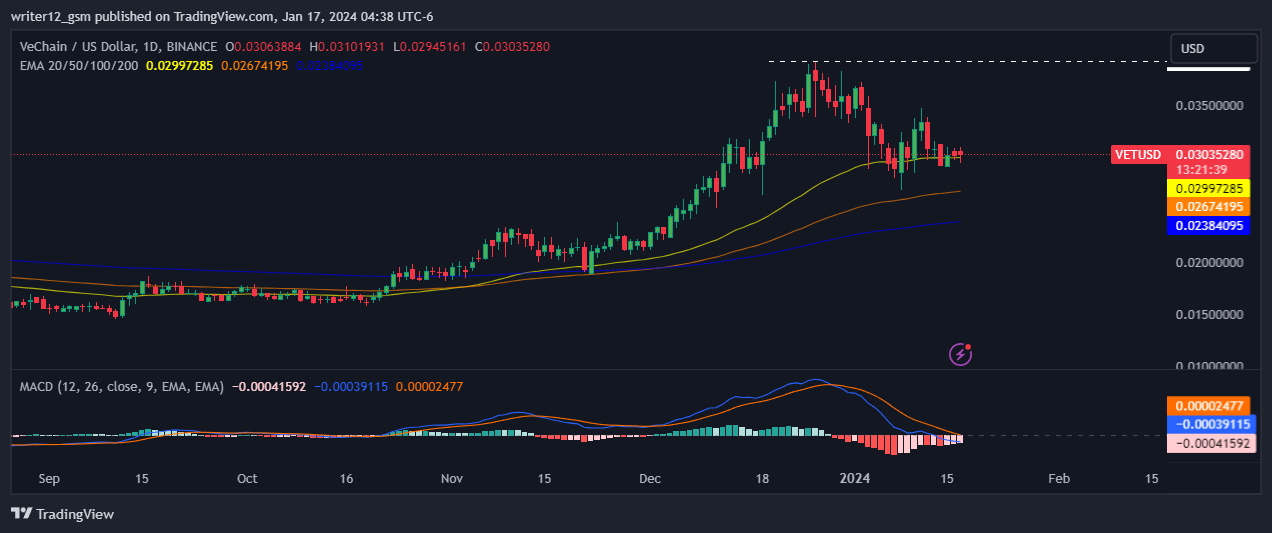
- 1 VeChain Price is trading above the key moving averages showcasing bullishness on the daily chart.
- 2 VET price showing a mild consolidation after a robust performance in previous months.
- 3 VeChain price forecast demonstrates the bounce back of the price from the dynamic support levels.
VeChain Price forecast demonstrates a bounceback after the correction phase. The price is currently trading above the key moving averages, showing bullishness on the daily charts.
The VET price is halted near the value of $0.03924693 and now it taking support above the 50 moving average, showing the buyers are still active at the lower levels.
VeChain price action indicates bullishness in the longer term, as the VET crypto keeps the gains on the upper side in the bullish zone and ignores the rejections. The bears are still making short positions and trying to cause a pullback in the crypto.
VeChain crypto displayed bullishness and kept holding the gains above the top. Bulls are accumulating the crypto and getting ready to cross upper levels in the next sessions.
The chart formation shows the bulls’ momentum and signals a positive outlook on the charts. VET crypto’s price is aiming to achieve a breakout soon and investors should watch it closely.
The price action shows a strong chart structure with buyers’ presence, and long buildup activity was noted in the past trading sessions. Furthermore, sellers were now becoming cautious due to the vertical rally that trapped sellers in the past months. However, they are trying to pull down the crypto price.
Technical Analysis of VeChain Crypto Price in 1-D Timeframe
VeChain ( USD: VET) has steadily seen its crypto price rise for the past three months, gaining 87.75% and 3.29% in the last month. Currently, VET crypto has been trying hard to hold on to this level after an unexpected correction in price.
Currently, VeChain crypto (USD: VET) is trading above the 50 and 200-day DMAs (Daily moving averages), which are supporting the price momentum.
The MACD line at -0.00039115 and the signal line at 0.00002477 are above the zero line. A bearish crossover is observed in the MACD indicator, which signals weakness in the momentum of the VET crypto price.
The current value of RSI is at 46.79 points. The 14 SMA is above the median line at 47.11 points, which indicates that the VeChain crypto is neutral.
Summary
The VeChain Crypto Price showing a mild correction on the daily chart. It is currently taking support on the key moving averages, showing buyers’ presence in the lower levels. The key indicators like MACD, RSI, and EMAs are showing mild weakness in the price. However, price action suggests that the price is bullish in the long term and a bounce back may occur from the lower levels.
Technical Levels
Support Levels: $0.02673426 and $0.02383713.
Resistance Levels: $0.03471292 and $0.03924693.
Disclaimer
This article is for informational purposes only and does not provide any financial, investment, or other advice. The author or any people mentioned in this article are not responsible for any financial loss that may occur from investing in or trading. Please do your research before making any financial decisions

Adarsh Singh is a true connoisseur of Defi and Blockchain technologies, who left his job at a “Big 4” multinational finance firm to pursue crypto and NFT trading full-time. He has a strong background in finance, with MBA from a prestigious B-school. He delves deep into these innovative fields, unraveling their intricacies. Uncovering hidden gems, be it coins, tokens or NFTs, is his expertise. NFTs drive deep interest for him, and his creative analysis of NFTs opens up engaging narratives. He strives to bring decentralized digital assets accessible to the masses.


