
 Home
Home News
News

- 1 The RUNE price showcased a reversal from the top and is revealing selling pressure.
- 2 Buyers have lost their initial momentum and are unwinding their positions.
The RUNE token has switched the buying action from the high of $7.10 and is facing selling pressure now. Additionally, the token has formed a falling channel pattern and delivers the lower low swings. The token has also cracked multiple support zones during retracement, which is a sign of short additions. Along with the retracement, the 100-day EMA mark was broken in the last session, which is too negative for short-term investors.
The THORChain (RUNE) crypto is now heading toward the 200-day EMA zone, indicating selling pressure on the charts. Moreover, the trend favors the sellers, and the token may continue to drag the gains. The token did not hold the gains in the bullish territory and faced a sharp push by the bear cartel, resulting in a decline of over 40% in the last sessions.

This cryptocurrency’s price is trading at $4.15 at press time, with an intraday drop of 11.33%, showing selling pressure. Moreover, the trading volume increased by 17.30% to $276.89 Million, highlighting bearishness. The pair of RUNE/BTC was noted at 0.0000974 BTC, while the market cap is $1.25 Billion. Analysts are neutral and suggest that the RUNE token will face volatility in the following sessions.
RUNE On Daily Charts Displays Selloff From Highs
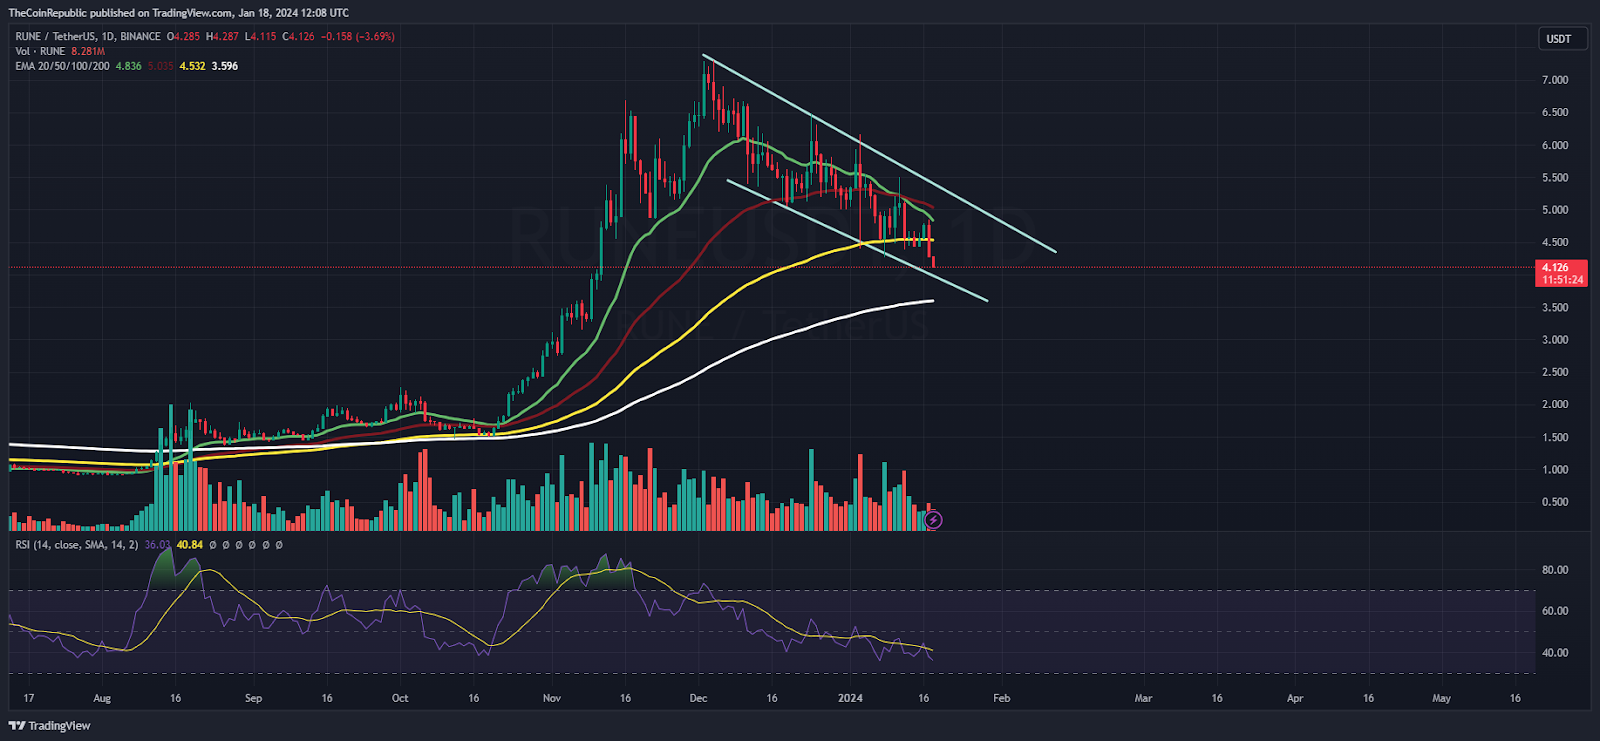
On the daily charts, the RUNE token displays bearish flaws and retests the support zone alternately but cannot halt the gains. The token is heading toward the 200-day EMA mark and redirects the selling pressure. Bear cartels looked aggressive now and were damaging the long positions badly. The short-term trend is negative and the token may face further declines in the following sessions.
The RSI curve slipped to the oversold region and displayed a negative divergence, indicating a selloff in the recent sessions. Moreover, the MACD indicator shows a bearish crossover and forms red bars on the histogram, directing the underperformance on the charts.
RUNE Retesting 20-Day EMA Mark On Weekly Charts
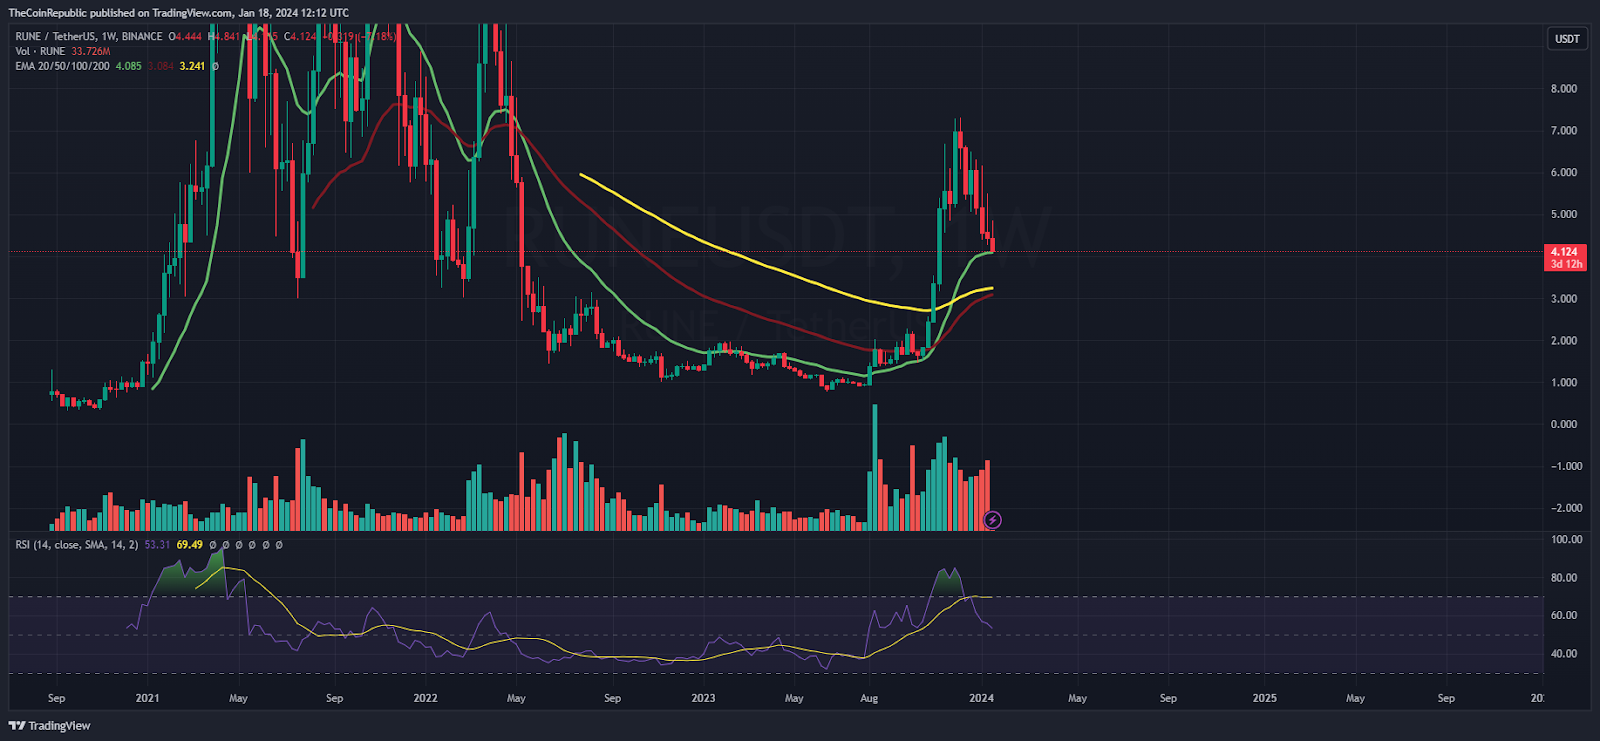
On the weekly charts, the RUNE price retested the 20-day EMA mark and showed a retracement in the recent sessions. Amid the market’s positive sentiments, RUNE crypto failed to extend the gains due to extreme volatility. The investors have squared off their gains due to fear, which led the token to revert from highs.
Summary
The THORChain (RUNE) token displayed a selloff and slipped below the support zone of $4.50, reflecting bearishness. Moreover, the token is heading to retest the round mark of $4, revealing bear dominance in the recent sessions.
Technical Levels
Support Levels: $4.00 and $3.80
Resistance Levels: $4.30 and $4.50
Disclaimer
The views and opinions stated by the author or any other person named in this article are for informational purposes only and do not constitute financial, investment, or other advice. Investing in or trading crypto or stocks comes with a risk of financial loss.

Andrew is a blockchain developer who developed his interest in cryptocurrencies while pursuing his post-graduation major in blockchain development. He is a keen observer of details and shares his passion for writing, along with coding. His backend knowledge about blockchain helps him give a unique perspective to his writing skills, and a reliable craft at explaining the concepts such as blockchain programming, languages and token minting. He also frequently shares technical details and performance indicators of ICOs and IDOs.


