
 Home
Home News
News

- 1 The stock displays selling pressure and is on the verge of a breakdown.
- 2 Buyers are in trouble and are unwinding their long positions.
RobinHood Markets Inc. (NASDAQ: HOOD) HOOD stock implied bearishness and skimmed from the supply zone of $13. The price action reveals the selling pressure and short buildup activity. The stock persisted in slumping the gains for the past sessions. The bears looked aggressive and follow-on selling pressure led the stock to crash by over 20% this week.
The Massachusetts Case with the firm recently came into the spotlight, which badly affected the stock price. The regulators made allegations against the firm for using gamification strategies to attract customers. After a long dispute, the firm finally agreed to pay $7.5 Million and settled the case.

The stock is now at a make-or-break level near $10.50, close to the 200-day EMA support. The stock portrayed a sharp correction and gap down swings disclosed the bears dominance. Additionally, the lower low swings were shown, which favored the bearishness.
At yesterday’s close, the stock was at $10.67 with an intraday gain of 0.19%, exhibiting flat moves. Moreover, the trading volume was noted at 8.032 Million, and the market cap was at $17.319 Million. Analysts are neutral and suggest the target price to $12.85 which was tested recently.
(NASDAQ: HOOD) On Daily Charts Exhibits Selloff

On the daily charts, the financial service platform signifies a selloff and arrays roller coaster moves, overseeing the volatility in the recent sessions. Investors are in fear and are squaring off their gains due to the adverse sentiments in the stock. The option chain data shows a massive short addition at a strike price of $11, with an open interest of 19791 lakh shares.
The Relative Strength Index (RSI) curve stayed in the oversold region, directing the selling pressure and the bears’ dominance. The MACD indicator signifies the bearish crossover and the underperformance on the charts.
HOOD Stock On Weekly Charts Shows Sharp Reversal
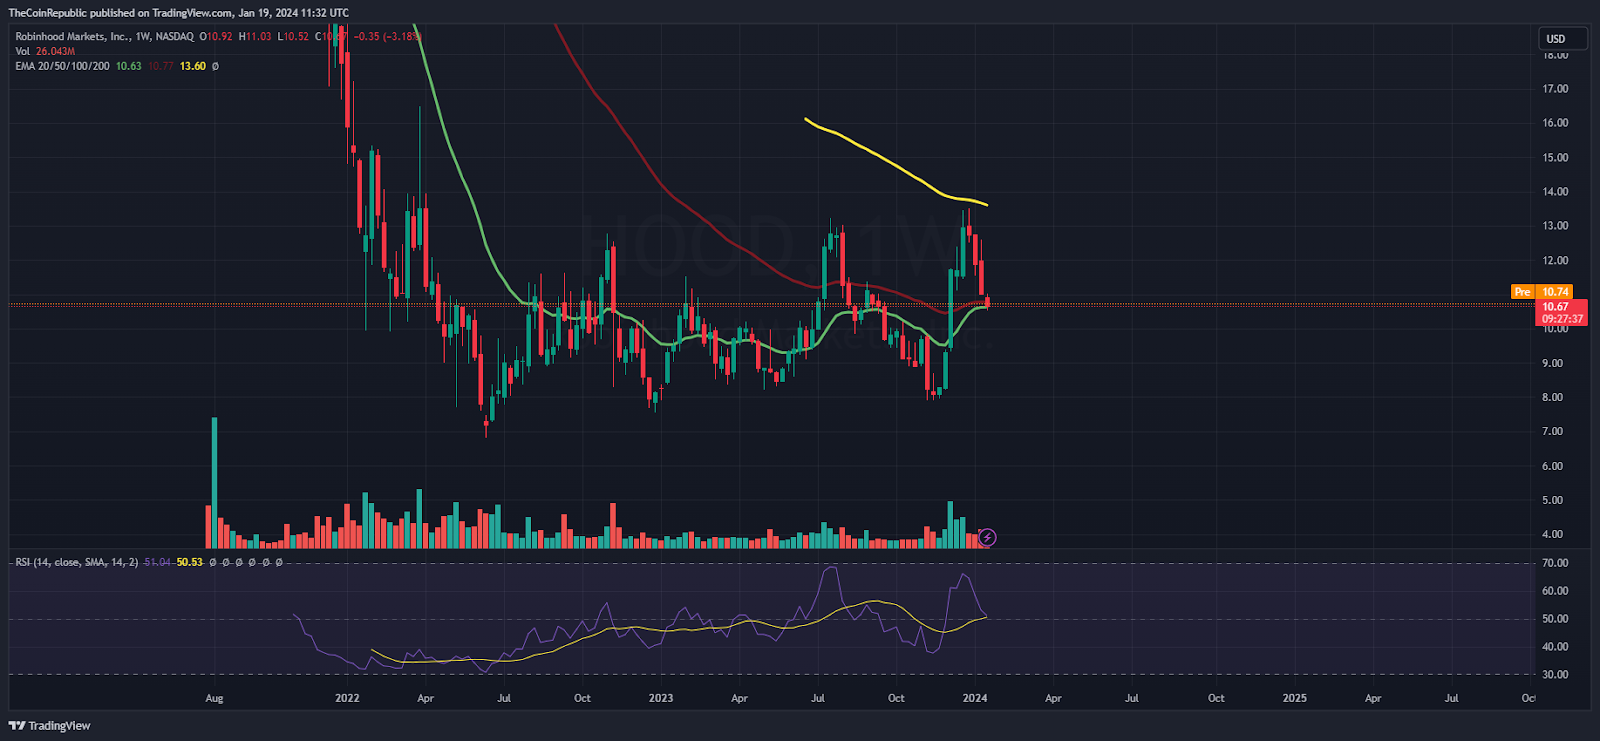
On the weekly charts, the stock displays sharp ejection from the 100-day EMA, and a three-black-crow pattern was exhibited, which signifies the bearish move. Moreover, the stock is reversed to the critical support zone of $10.50 and is endeavouring to immerse the selloff. However, the technical indicators signal an oversold outlook and a temporary bounce may be seen shortly.
Summary
HOOD stock implies a rash selloff and has leafed from the supply zone, which conveys the bearishness in the recent sessions. Moreover, the stock rotted the initial gains and dropped to the bottom, which tangled the bulls. However, the short-term trend is neutral, and the stock may attain a bounce soon.
Technical Levels
Support Levels: $10.40 and $10
Resistance Levels: $10.90 and $11.20
Disclaimer
The views and opinions stated by the author or any other person named in this article are for informational purposes only and do not constitute financial, investment, or other advice. Investing in or trading crypto or stocks comes with a risk of financial loss.

Amanda Shinoy is one of the few women in the space invested knee-deep in crypto. An advocate for increasing the presence of women in crypto, she is known for her accurate technical analysis and price prediction of cryptocurrencies. Readers are often waiting for her opinion about the next rally. She is a finance expert with an MBA in finance. Quitting a corporate job at a leading financial institution, she now engages herself full-time into financial education for the general public.


