
 Home
Home News
News
- 1 Graph price is trading in the bears’ grasp, heading.
- 2 GRT price is still above the 100 and 200-Day moving averages.
Graph price analysis showcases the bear’s dominance over the bulls on the daily time frame chart. Bears are pulling the price in the downward direction breaking below the key moving averages.
Graph price has declined by 5.50% over the past 7 days, whereas according to the price action, the GRT price continues to move under the bear’s influence. bears are trying to pull Graph crypto prices toward the lower trendline. The graph must attract bulls to surge toward the upper trendline. Investors in Graph Crypto need to wait for any directional change over the daily time frame chart.
Graph price analysis showcases the decline of GRT crypto price from the higher level over the daily time frame chart. GRT crypto needs to attract buyers to breach the upper levels and sustain above them. However, trading volume has been below average and needs to show some sign of growth to sustain at a higher level.
Moreover, GRT crypto is trying to break above the 20, and 50-Day Daily Moving Averages (DMA). Graph price has lost 2.42% in a month and 12.46% in the last year to date. Last week, it showed a decline of 5.50% as per the trading view data.
Technical Analysis of Graph Crypto Price in 1-D Time Frame
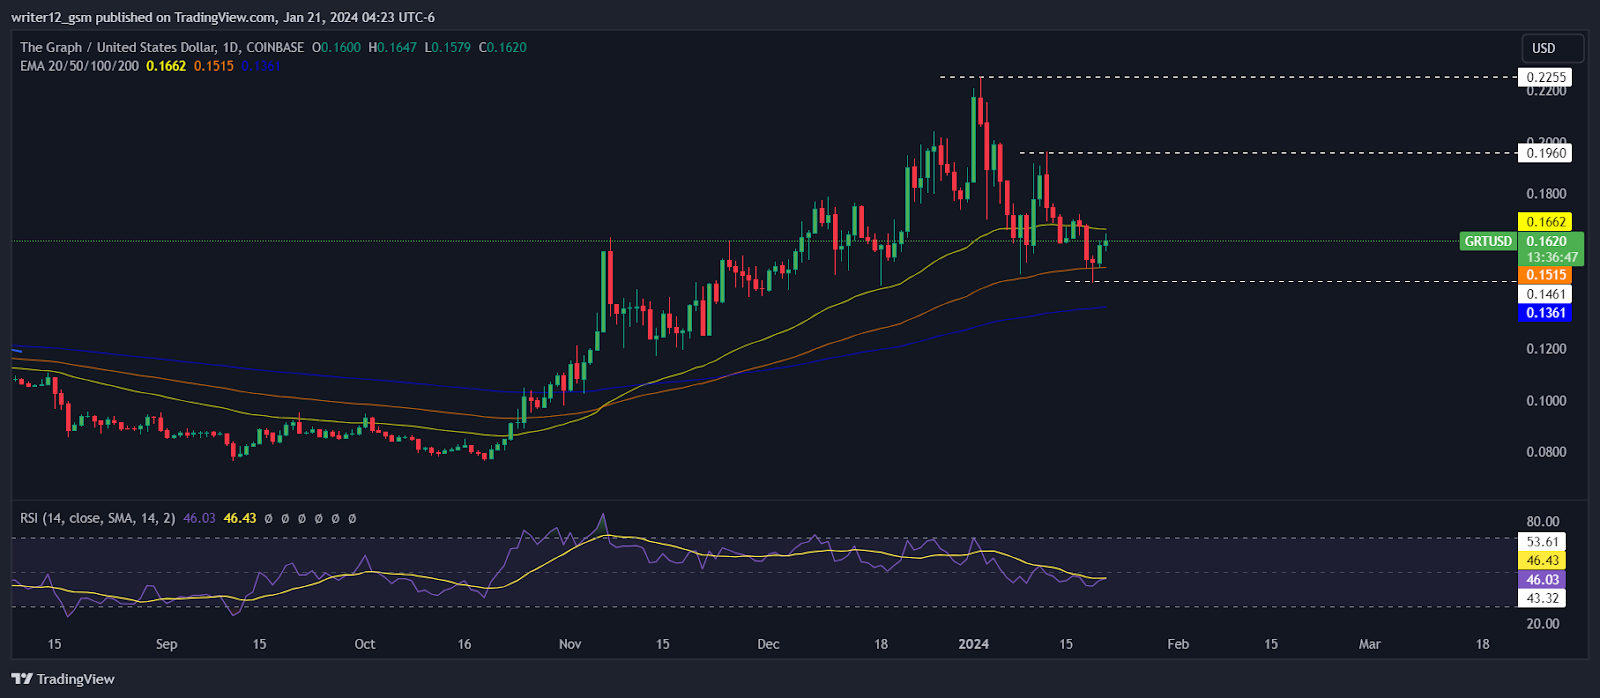
If the price can sustain at this level, the Graph price could bounce back and reach the first and second targets of $0.1960 and $0.2255. However, if the GRT price cannot maintain this level and falls, then it might hit the closest support levels of $0.1461 and $0.1361.
At the time of publishing, Graph crypto (USD: GRT) is trading above the 100 and 200-Day EMAs, which are supporting the price trend.
The GRT price may face more downward pressure as more sellers enter the market and break the support levels of the EMA indicators. The GRT price is likely to continue its bearish trend on the daily chart.
The technical indicators confirm the negative outlook of the GRT crypto price. The relative strength index shows the falling momentum of Graph crypto. RSI was below the middle line and is moving towards the neutral to be oversold.
MACD also shows the downward trend of GRT crypto price. The MACD line is under the signal line after a negative crossover. Investors in GRT crypto should wait for any sign of reversal on the daily chart.
Summary
The GRT price is on a downward slope on the daily chart according to the GRT price forecast from the high level. GRT cryptocurrency needs to attract buyers to bounce back and reach high levels. Technical signals show that the GRT price is in a bearish trend. Investors in GRT cryptocurrency should monitor the daily chart for any signs of reversal.
Technical Levels
Support Levels: $0.1461 and $0.1361.
Resistance Levels: $0.1960 and $0.2255.
Disclaimer
This article is for informational purposes only and does not provide any financial, investment, or other advice. The author or any people mentioned in this article are not responsible for any financial loss that may occur from investing in or trading. Please do your own research before making any financial decisions

Amanda Shinoy is one of the few women in the space invested knee-deep in crypto. An advocate for increasing the presence of women in crypto, she is known for her accurate technical analysis and price prediction of cryptocurrencies. Readers are often waiting for her opinion about the next rally. She is a finance expert with an MBA in finance. Quitting a corporate job at a leading financial institution, she now engages herself full-time into financial education for the general public.


