
 Home
Home News
News
- 1 Mina’s price is trading below the key moving averages showcasing bearishness.
- 2 Mina crypto is heading downward, showcasing bearish dominance on the daily chart.
Mina’s price is trading in the bear’s hold heading downward breaking below the key moving averages, showcasing bearishness on the daily charts.
The crypto is taking rejection from the upper resistance levels as sellers are pulling the price down. The price was halted near the value of $1.699 and from there, bears overtook the bulls and the control of the price.
The price is still trading above the key moving averages of 100-day and 200-day EMAs, so the hopes are still alive for the buyers and probably the price might bounce back from its dynamic supports.
As per the trading view currently, the MINA price is trading at the level of $0.976 with a phenomenal drop of 5.24% with a 24-hour trading volume of 50.154 Million and a market cap of 1.016 Billion.
The performance of the crypto has been volatile throughout the year. The price has been bearish in recent times as it is down by approximately 19.72 in a week and it was down by 5.33% in the previous month. However, the 6-month return of the crypto is 123.06%, demonstrating the bears were aggressive in the past session after a long bullish momentum.
Technical Analysis on the 1-day time frame
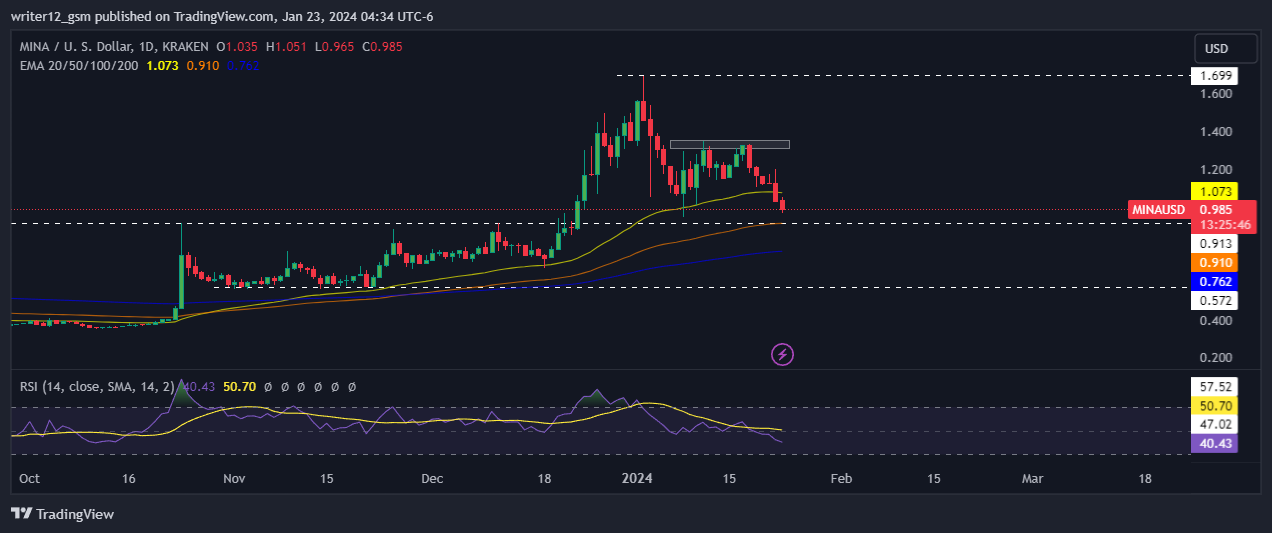
The price breaks below the 20 and 50-day moving averages, showcasing bearishness. However, the price is still above the key moving averages of 100-day and 200-day, showcasing price still has a good support level and probably a bounce-back might seen in the upcoming days.
The key indicators like the MACD and RSI curve are demonstrating a clear bearish trend in the price.
The MACD is heading downward breaching the middle line and below the signal line. A death cross is noted on the chart and red bars on the histograms indicate the bear’s dominance.
The RSI curve is heading downward below the middle line at 40.22, showcasing the sellers were aggressive in the previous sessions.
The MINA price is also bearish in the weekly timeframe. It is taking a rejection from the 100-day EMA and the RSI curve is also heading downward, hinting at the bearishness in the MINA price. The price action demonstrates the buyers have failed to breach the dynamic resistance levels and the trend has gone bearish.
Conclusion
On this daily timeframe, the MINA price is looking bearish as it breaks below the 20 and 50 moving averages and heading towards the 100 and 200-day moving averages. Key indicators like MACD and RSI also indicate aggressive bearish moves in the price as both are trading in the negative zones.
Technical Levels
Support Levels: $0911 and $0.762.
Resistance Levels: $1.336 and $1.699.
Disclaimer
This article is for informational purposes only and provides no financial, investment, or other advice. The author or any people mentioned in this article are not responsible for any financial loss that may occur from investing in or trading. Please do your research before making any financial decisions

Nancy J. Allen is a crypto enthusiast, with a major in macroeconomics and minor in business statistics. She believes that cryptocurrencies inspire people to be their own banks, and step aside from traditional monetary exchange systems. She is also intrigued by blockchain technology and its functioning. She frequently researches, and posts content on the top altcoins, their theoretical working principles and technical price predictions.


