
 Home
Home News
News
- 1 HUT 8 stock showcased a breakdown and is revealing selling pressure.
- 2 Bears are showcasing their legacy and are making fresh short positions.
HUT (NASDAQ: HUT) revealed a downtrend and breached the make-or-break level of $8 in the recent sessions. Moreover, the follow-on selling pressure persisted and stock continued to drain the gains amidst the downtrend. The price action showcased the selling pressure and is replicating underperformance. Furthermore, the stock has broken out of its crucial support zone and is exhibiting bearish dominance.
The HUT stock breached the demand zone and fresh selling momentum was witnessed and bears persisted in making fresh short positions which led bulls into trouble. Moreover, the technicals are suggesting that the stock may continue to decline gains and may suffer bearishness in the upcoming sessions.
Furthermore, the option chain suggests the short buildup activity and open interest on the call side increased to 250 hundred shares at the strike price of $6.50. This activity reveals that bears are continuing to put pressure on and keen to push HUT 8 toward $6.
At yesterday’s close, HUT stock was at $6.35 with an intraday gain of 0.32% displaying flat moves and forming a doji candlestick. However, the trend is bearish and selling pressure may persist and will continue to stretch the downfall. Analysts are neutral and give a yearly target price of $9.28, whereas the technicals are guiding a sell signal.
HUT On Daily Charts Displays Breakdown
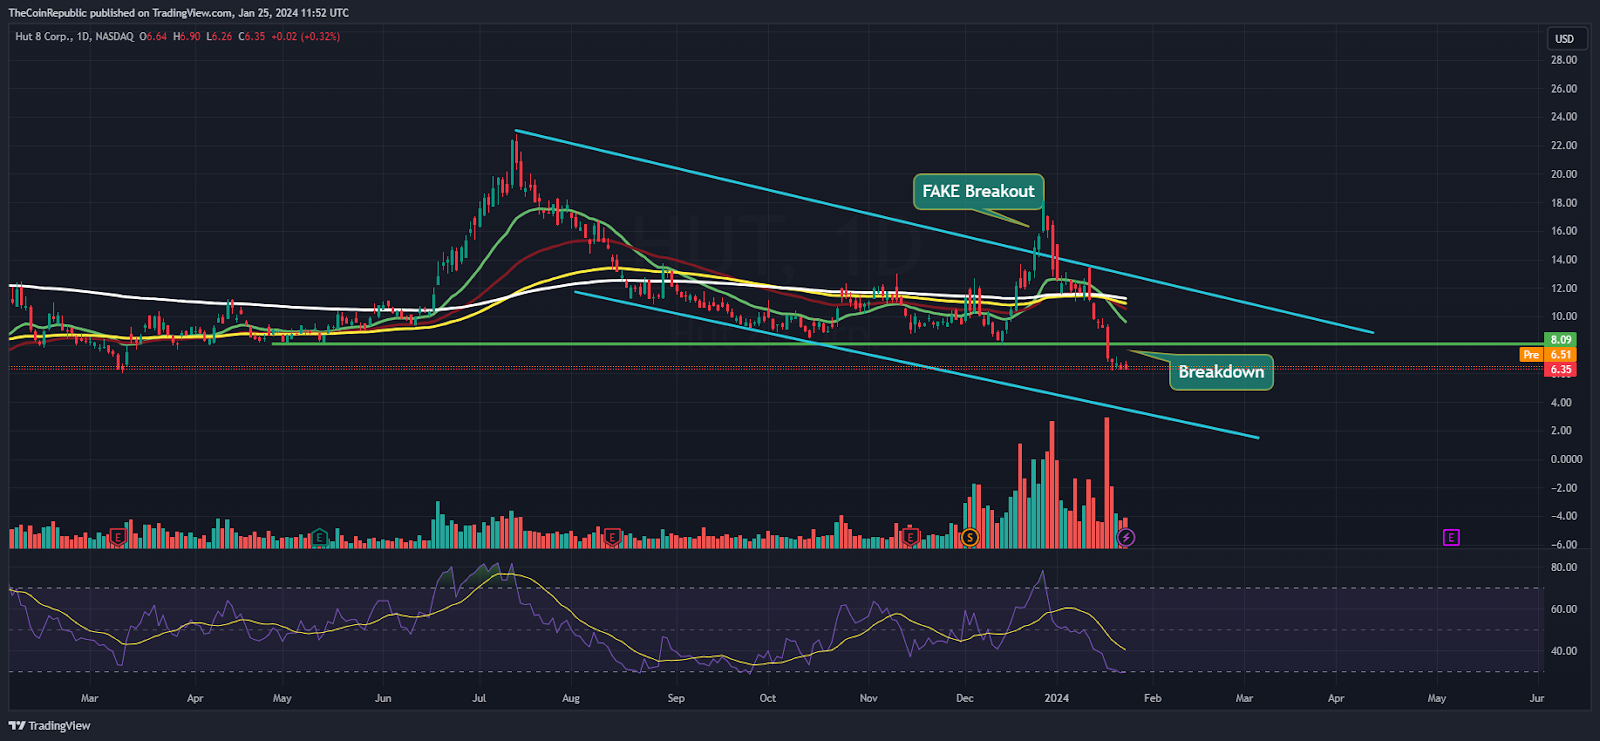
On the daily charts, a falling channel pattern was noted and stock exhibited a fake breakout and trapped the bulls in the past sessions. Moreover, the stock persisted in forming the lower low swings, and a bearish crossover was witnessed. The stock created a fresh low below $8 and three black crows pattern was noted, which is a sign of the sellers’ control over the stock.
The relative strength index (RSI) curve slipped to the oversold region and is forming a negative divergence revealing a downtrend. The MACD indicator shows a bearish crossover and formed red bars on the histogram, suggesting a major downfall and the stock may continue to extend the fall.
HUT On Weekly Charts Reveals Rejection From Highs
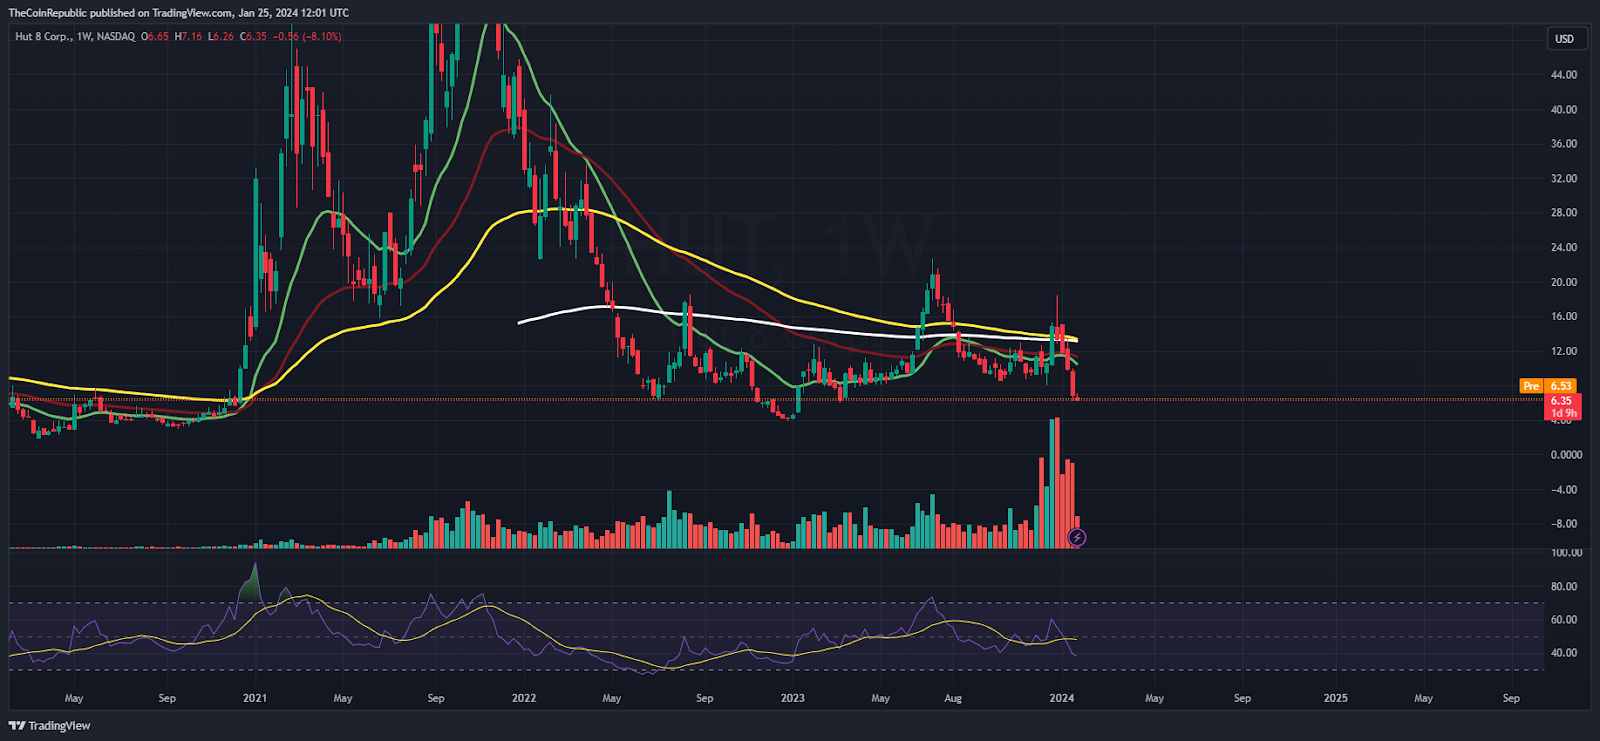
On the weekly charts, HUT stock price has reverted to the up move, and a fresh selling momentum was noted in the recent sessions. Moreover, the stock has formed an inverted hammer candlestick near the 100-day EMA and a trend reversal was noted. Per the Fib levels, HUT stock has slipped below the 23.6% zone and stock reveals a major correction.
Summary
HUT stock (NASDAQ: HUT) price slipped below its demand zone of $8 and is revealing a selloff in the recent sessions. The price action delivers lower low swings and is reflecting underperformance. The technical indicators are signaling a fresh breakdown and the stock may continue to drag the gains in the next sessions.
Technical Levels
Support Levels: $6 and $5.30
Resistance Levels: $6.80 and $7
Disclaimer
The views and opinions stated by the author or any other person named in this article are for informational purposes only and do not constitute financial, investment, or other advice. Investing in or trading crypto or stocks comes with a risk of financial loss.
Steve Anderson is an Australian crypto enthusiast. He is a specialist in management and trading for over 5 years. Steve has worked as a crypto trader, he loves learning about decentralisation, understanding the true potential of the blockchain.


