
 Home
Home News
News
- 1 Quant crypto could continue going for a bigger fall, as it fails to go up from the resistance level.
- 2 The QNT crypto has experienced a slight decline of 0.13% in the last 24 hours, trading at $109.10.
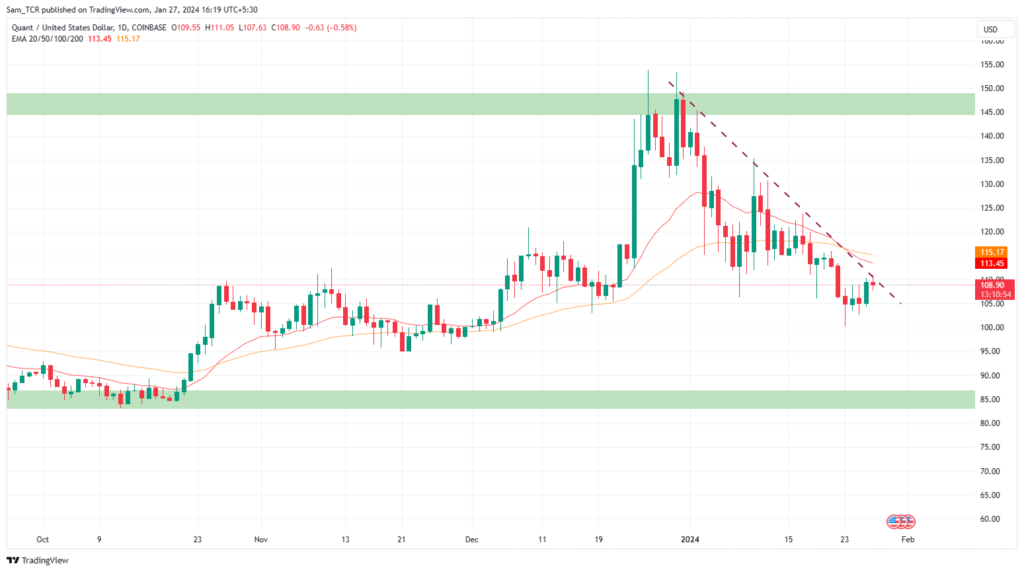
The QNT crypto faced some challenges earlier on the chart and made a great comeback as the price bounced back from a low point of around $85 on the charts.
When the price was going up earlier on the chart, the QNT asset revealed a bullish structure on the daily chart as it climbed higher. It recorded good results in the previous quarter by (+5.08%), implying a steady upward movement.
However, recently, the price went down from the upward trend which made the price go down sharply from the high point of around $150 on the charts. But the price broke the upward trend and it went below.
Quant crypto could continue going for a bigger fall, as it fails to go up from the resistance level and goes down to new lows by breaking the structure downwards and following a downward trendline smoothly. This showed that it was going down consistently and without much interruption. It shows that there is more selling pressure than buying pressure at that point.
The price went down in an attempt to reach lower depths, in the process it broke the structure downwards, and it went below the previous swing low points.
The QNT crypto asset is showing bearish features and can lose more value. It has shown poor performance in the past week, and past month, by 4.59% and 21.99% respectively.
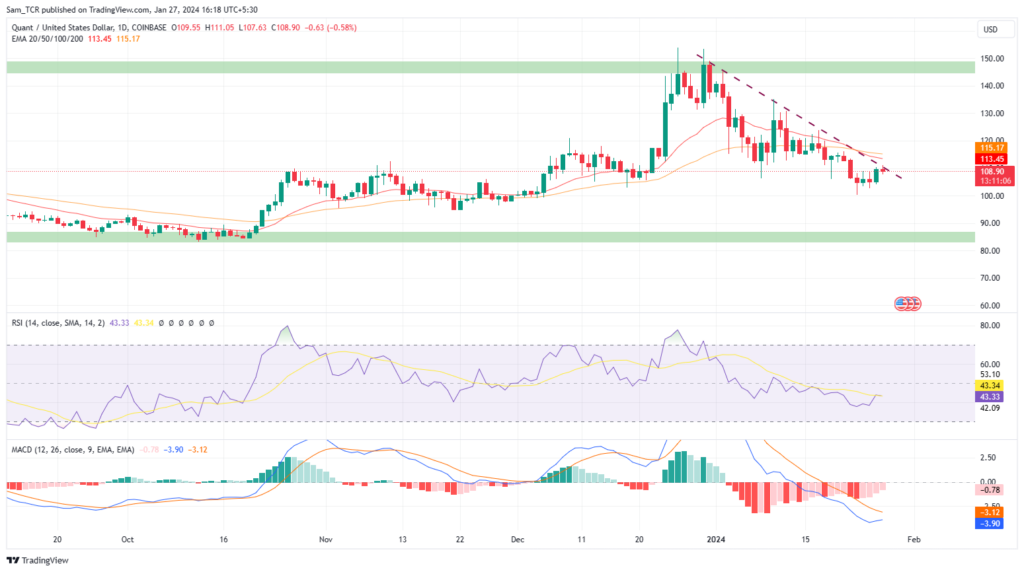
The Quant asset is bearish and shows that it has more room to go down as it goes below major 20 and 50-Day EMAs. The price went below these bands, which means that it was lower than the average price over these periods. Depending on the selling pressure, the QNT crypto price could drop more.
The QNT asset is displaying bearish characteristics as MACD is at -3.88 with a bearish crossover. Meanwhile, the RSI is at 43 and fell smoothly; the curve is below the median line, implying that the Quant asset is losing momentum and could seek new depths.
The QNT crypto has experienced a slight decline of 0.13% in the last 24 hours, trading at $109.10. Therefore, if the QNT crypto price fails to stay above the $100 level, it could decline further.
However, if the demand for the QNT crypto advances, the asset price could bounce back from the current level and could break the trendline as well. The next goal for the price is to reach $130.
Summary
The Quant asset is bearish and shows that it has more room to go down as it goes below major 20, and 50-day EMA’s, depending on the seller’s pressure, QNT price could drop more.
The price went below these bands, which means that it was lower than the average price over these periods. This showed that the QNT crypto was in a downtrend and losing value.
Depending on the seller’s pressure, the QNT crypto price could drop more. Therefore, if the QNT crypto price fails to stay above the $100 level, it could decline further.
Technical Levels
Support Levels: $100
Resistance Levels: $130
Disclaimer
In this article, the views, and opinions stated by the author, or any people named are for informational purposes only, and they don’t establish the investment, financial, or any other advice. Trading or investing in cryptocurrency assets comes with a risk of financial loss.

With a background in journalism, Ritika Sharma has worked with many reputed media firms focusing on general news such as politics and crime. She joined The Coin Republic as a reporter for crypto, and found a great passion for cryptocurrency, Web3, NFTs and other digital assets. She spends a lot of time researching and delving deeper into these concepts around the clock, and is a strong advocate for women in STEM.


