
 Home
Home News
News
- 1 The DOT token price shows a falling wedge pattern on the daily charts.
- 2 Polkadot crypto’s price slipped over 30% in the last week, replicating profit booking.
DOT, the native token of Polkadot, displays lower low formation and is hovering near the 20-day EMA mark, revealing selling pressure in the recent sessions. Moreover, the token is on the verge of a breakdown and is holding the move at its support mark of $7. The DOT crypto price action also signifies the volatile move and replicating selling pressure.
The DOT price slips from the top of $9.50 and is experiencing correction among its peers due to the broad market negative sentiments. However, the trend is neutral, and the token price may spray gains above $7.20, the prompt trendline hurdle. A morning star candlestick was formed on the 200-day EMA, which conveys a pullback during the down move.
The price of the cryptocurrency was $7.01 at press time, with an intraday gain of 2.60%, showing neutrality. Moreover, the trading volume increased by 47.91% to $348.04 Million, highlighting investor interest. The pair of DOT/BTC was noted at 0.000161 BTC, while the market cap is $9.46 Billion. Analysts are bullish and suggest the token will soon spray gains above $8.
The DOT Crypto Price on Daily Charts Reveals Falling Wedge Pattern
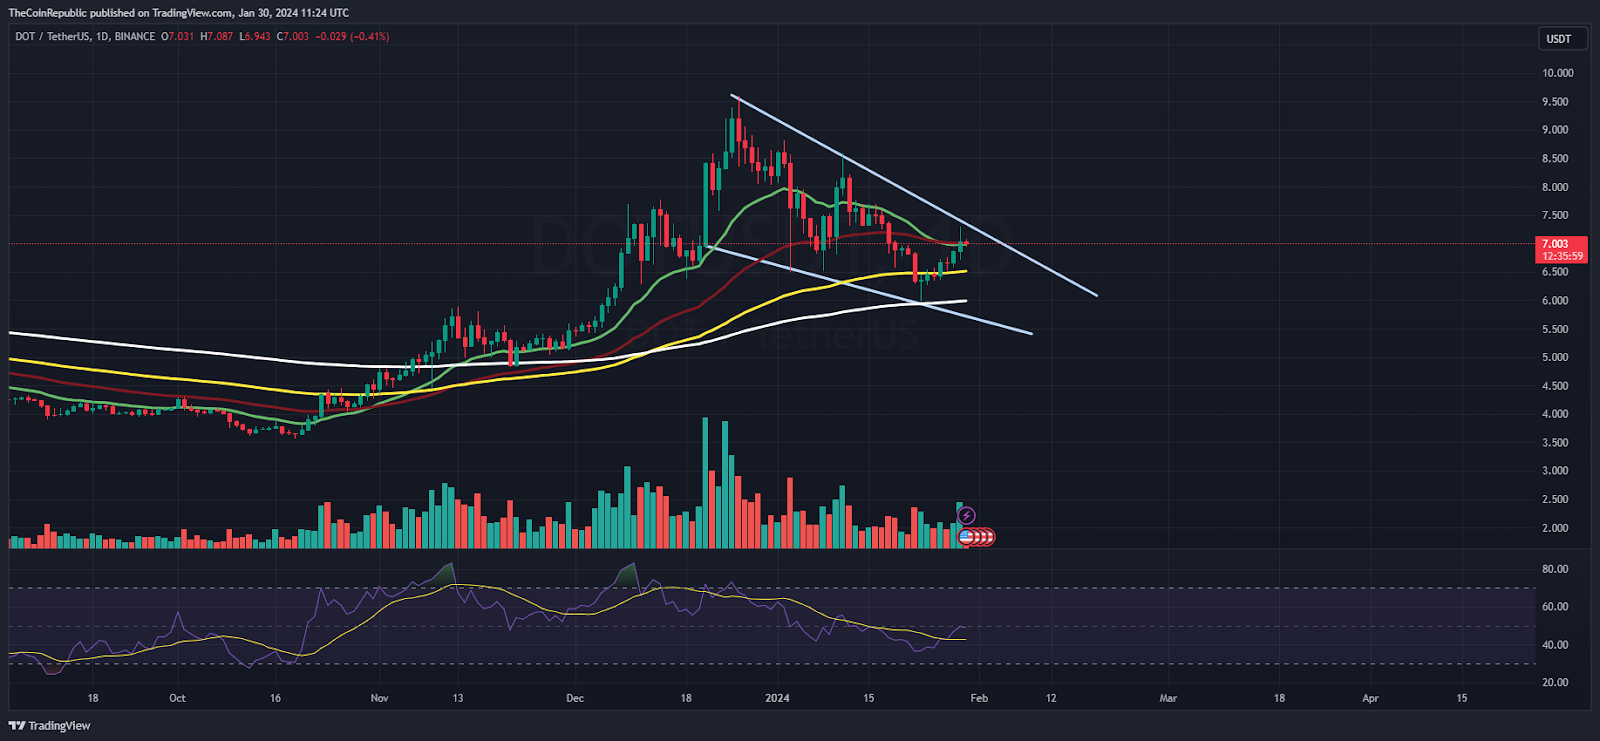
On the daily charts, the DOT token price showcased a falling wedge pattern and selling pressure was witnessed in the recent sessions. Moreover, the price action reveals mighty bear strength, and the sellers are trying for a breakdown below the 200-day EMA. The token has an immediate support zone of $6.00 above it and neutrality is anticipated, whereas a fresh selloff can be seen if breached.
The RSI curve stayed below the midline, revealing a trend reversal in the recent sessions. The MACD indicator shows a bearish crossover and the selling pressure may continue in the upcoming sessions.
DOT on Weekly Charts Displays Rejection From 100-Day EMA
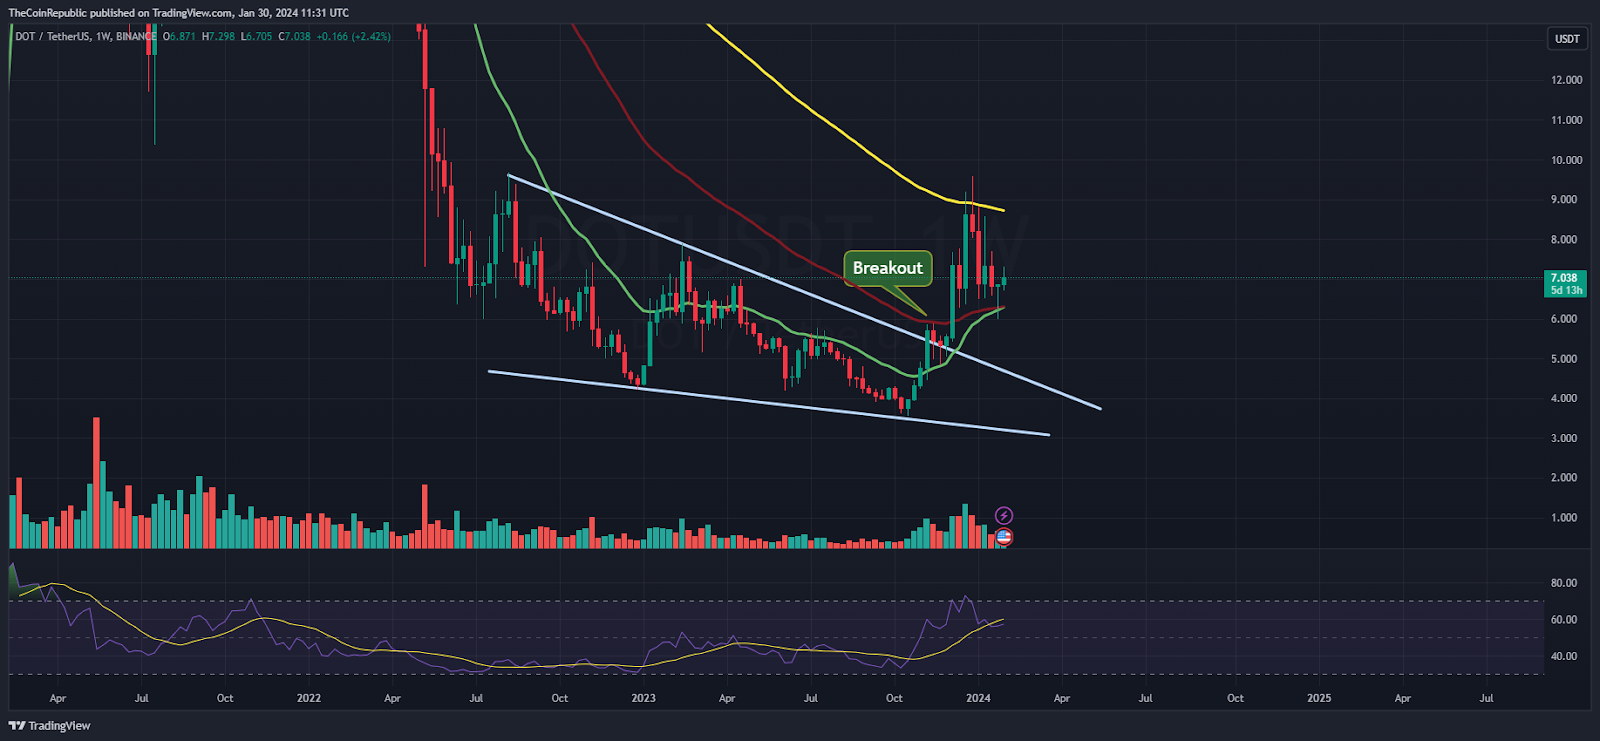
The Polkadot price has exited the correction phase and witnessed a falling wedge breakout above $5.90 in the past sessions. Afterward, the bullish move continued and the token retested the 100-day EMA mark, which acted as a barrier and the rally stopped. A rejection candlestick was formed on the top near $9 and a retracement was noted. That led the token to retest the support zone near the 20-day EMA mark.
Summary
Polkadot price experienced mild profit booking and has retested the 20-day EMA mark in recent sessions. Amidst the market correction, the token has pushed from the highs and is waiting for a rebound. However, the trend is intact and bulls might succeed in their mission and lift the token above $8 soon.
Technical Levels
Support Levels: $6.70 and $6
Resistance Levels: $7.30 and $8
Disclaimer
The views and opinions stated by the author or any other person named in this article are for informational purposes only and do not constitute financial, investment, or other advice. Investing in or trading crypto or stocks comes with a risk of financial loss.
Anurag is working as a fundamental writer for The Coin Republic since 2021. He likes to exercise his curious muscles and research deep into a topic. Though he covers various aspects of the crypto industry, he is quite passionate about the Web3, NFTs, Gaming, and Metaverse, and envisions them as the future of the (digital) economy. A reader & writer at heart, he calls himself an “average guitar player” and a fun footballer.


