


The Rocket Pool (RPL) token reflects range-bound moves and a fake breakout was noted in the recent sessions. The price action delivers low investor interest and there is no clear trend indication for the following sessions. Amidst the market volatility, the RPL token price still hovers in a biased range. It replicates an absence of momentum.
The RPL price tenses with the significant moving average and has faced consolidation for the past weeks. Despite the booming range breakout above $32, buyers could not spread the bull ride, and a sudden reversal led to a false breakout. Per the price action, the top of $32 and the low of $25 need to be breached for buying or selling momentum. The no trade zone is there in that region and RPL prices will continue to hover in the area.
The price of the cryptocurrency was $29.54 at press time with an intraday drop of 0.55%, showing neutrality. Moreover, the trading volume increased by 2.10% to $6.88 Million, highlighting the low investor interest. The pair of RPL/BTC was noted at 0.000685 BTC and the market cap is $553.08 Million. Analysts are neutral and suggest that the token will continue to hover in a narrow range. It can consolidate in the following sessions.
The RPL Price on Daily Charts Highlighting Consolidation
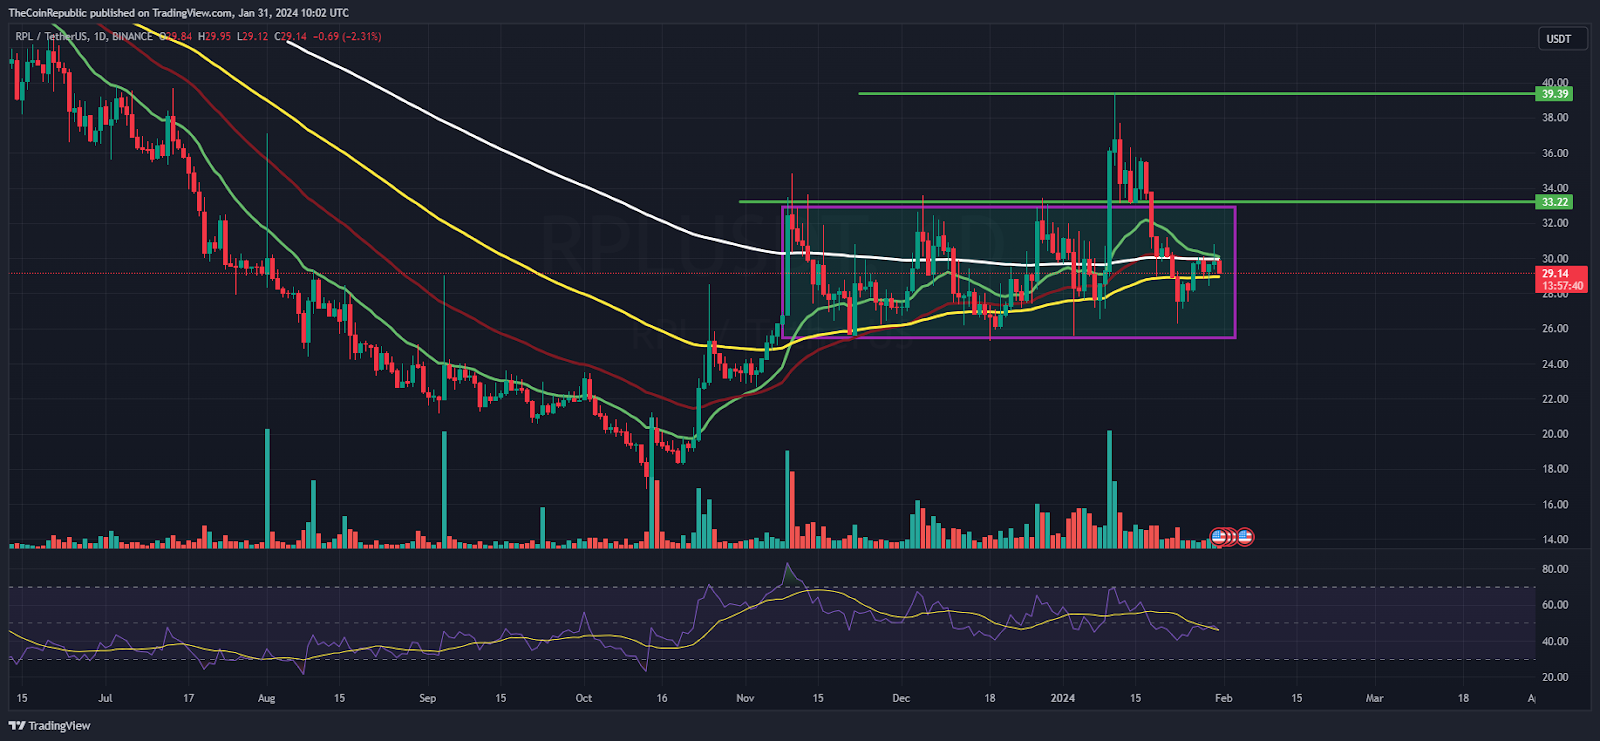
On the daily charts, the RPL token was in a narrow range and is delivering low investor interest. Despite the breakout shot, buyers did not lift the token above the prompt hurdle of $35, leading to a throwback. Furthermore, the price action signifies the battle between the bears and bulls, where sellers are keen to push the token toward its demand zone of $20.
The RSI curve stayed close to 55, depicting a negative divergence that suggests a breakdown in the upcoming sessions. Moreover, the MACD indicator shows a bearish crossover and signals a hidden divergence, which may lead to a selloff.
The RPL Price on Weekly Charts Displays a Rejection from the 50-Day EMA
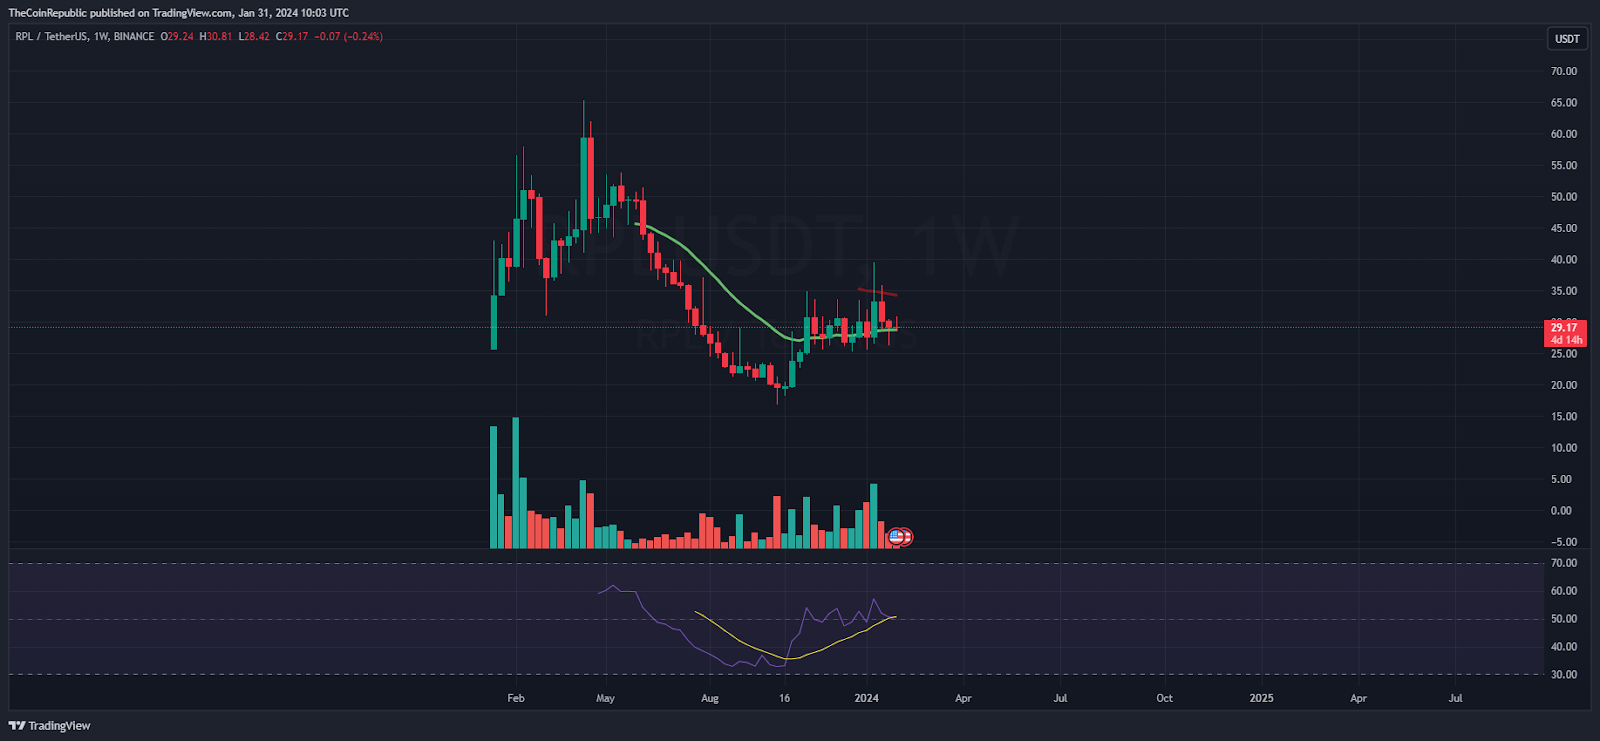
On the weekly charts, the RPL token price faced rejection from its 50-day EMA mark near $35, and a consolidation was witnessed. Additionally, the token did not replicate any apparent gesture. It is sailing in the middle of the Bollinger band spectrum. Above $32, bulls will take charge, whereas bears will trigger a selloff below $25.
Summary
The RPL token price was in a range and is hovering close to the resistance mark of $32. Below that level, bearishness can be anticipated with the target of $20 for the upcoming sessions. Due to the global market sentiments, a fake breakout was noted near $35 and the token retained its no-trade zone.
Technical Levels
Support Levels: $25 and $23
Resistance Levels: $32 and $35


