


 Flips from Top Amid Robust Q4 Earning Results")

The AMD stock (Advanced Micro Devices Inc.) cited a retracement from the top and retested the 20-day EMA mark in the last session. However, the trend is intact and a doji candle was formed, which still recalls a positive sign despite the selloff try. Moreover, the bulls have secured the 20-day EMA mark and upheld the bullish trajectory amid the strong Q4 results.
Yesterday, Q4 results came into the limelight, which was above the estimates, but the stock has rallied already, and a profit booking was witnessed. However, the dip is a buying opportunity for investors, and stock may continue rushing fireworks in the following sessions.
In yesterday’s session, the stock closed at $167.69 with an intraday fall of 2.54% delivering profit booking. Various analysts have raised the target price and maintained a buy rating, suggesting outperformance. Jefferies has increased the target price from $130 to $200, whereas Rosenblatt has increased the target price from $200 to $250, giving a strong buy outlook.
The AMD Price on Daily Charts Exhibits Uptrend
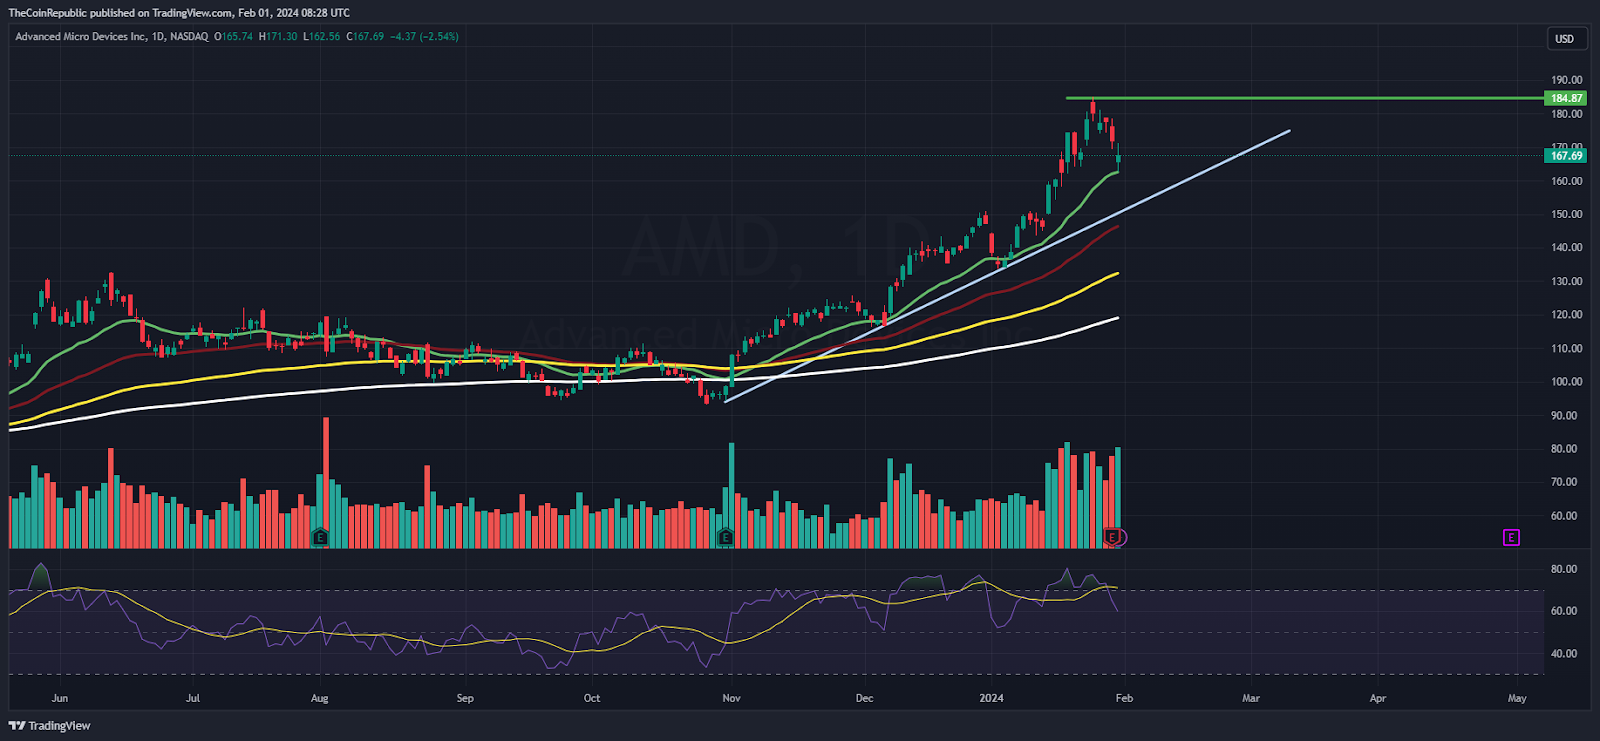
On the daily charts, AMD (NASDAQ: AMD) was in a stable uptrend and recited higher high swings for the past sessions. The follow-on buying momentum sharply ushered the stock from the base to the top and surged over 90% despite weak global sentiments. Furthermore, the price action favors the bulls and the stock may cross the $180 level to reach $200 in the upcoming weeks.
The RSI curve stayed above the midline and is forming a positive divergence, suggesting a bullish outlook. The MACD indicator shows a bearish crossover and indicates volatility for the following sessions.
Per the option chain data, strong call writing was done at $175, and buyers seemed trapped. The open interest increased to 17903 lakh shares, which is the prompt hurdle. Conversely, the open interest at $165 was raised to 77792 lakh shares, indicating a strong support zone.
The AMD Price on Weekly Charts Reflects Bullish Outlook
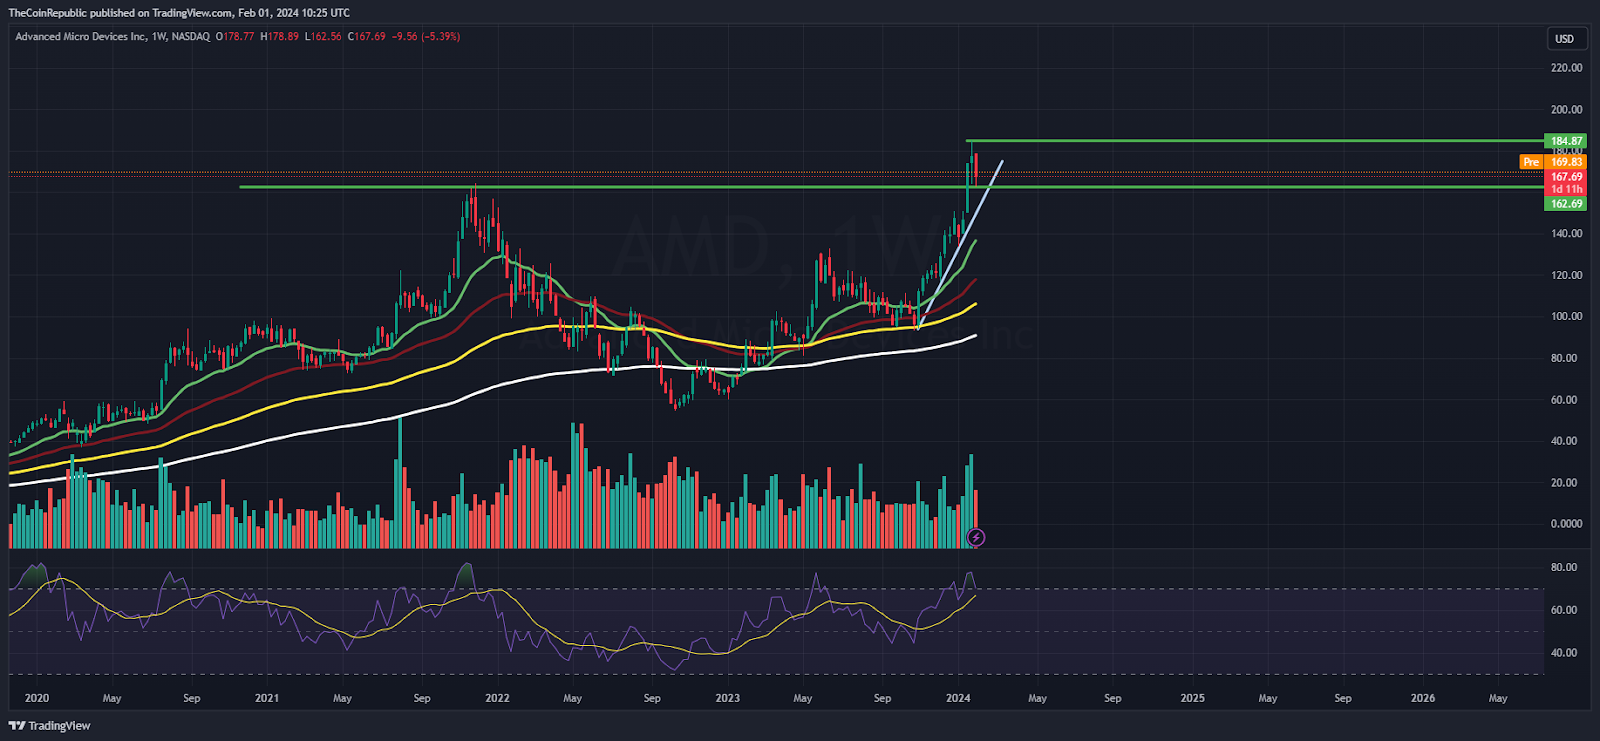
On the weekly charts, the AMD price has retested the neckline of the breakout region near $165 and may attain a sharp pullback soon. Despite the market volatility, the stock has persisted in outperforming the market and has given positive returns for investors. Per the Fibonacci zone, the stock was above the 50% level and is targeting to escape the 61.8% zone above $180.
Summary
The AMD stock has persisted in delivering outperformance and is preparing to catch $200 in the following sessions. Buyers have continued to extend the upmove and showcase their legacy. Furthermore, the bulls are gaining traction and are setting their vision to surpass the prompt hurdle of $180.
Technical Levels
Support Levels: $165 and $160
Resistance Levels: $170 and $175


