
 Home
Home News
News
- 1 HOOD stock price hovers near the 200-day EMA and is in a dilemma now.
- 2 Buyers are trying to attain a rebound and trying to save the gains.
HOOD (NASDAQ: HOOD) stock was in a dilemma and is hovering near its make-or-break level of $10, depicting a downtrend on the charts. Despite the pullback from the lows, the HOOD price did not surpass the supply zone and underwent a sharp push by the bears, which led the bulls in trouble. However, the stock needs to sustain above $10 to avoid any correction, which will lift the stock toward $12.
RobinHood Markets Inc. (HOOD) depicted a roller coaster move and delivered volatile swings for the past sessions. Moreover, the stock is bouncing between the 20-day and 200-day EMA zones and cannot cross the limits. The price action conveys the battle and indecisiveness between the bulls. Per the Fib levels, the HOOD price is above 23.6% and has shown bear dominance in the recent sessions.
At yesterday’s close, the HOOD stock was at the $10.74 level with an intraday drop of 2.45%, highlighting bearishness. Analysts were neutral, gave a yearly target price of $12.85, and maintained a hold rating. The technical indicators give a sell alert and suggest a down move in the following sessions.
The HOOD Stock Price on Daily Charts Delivers Correction
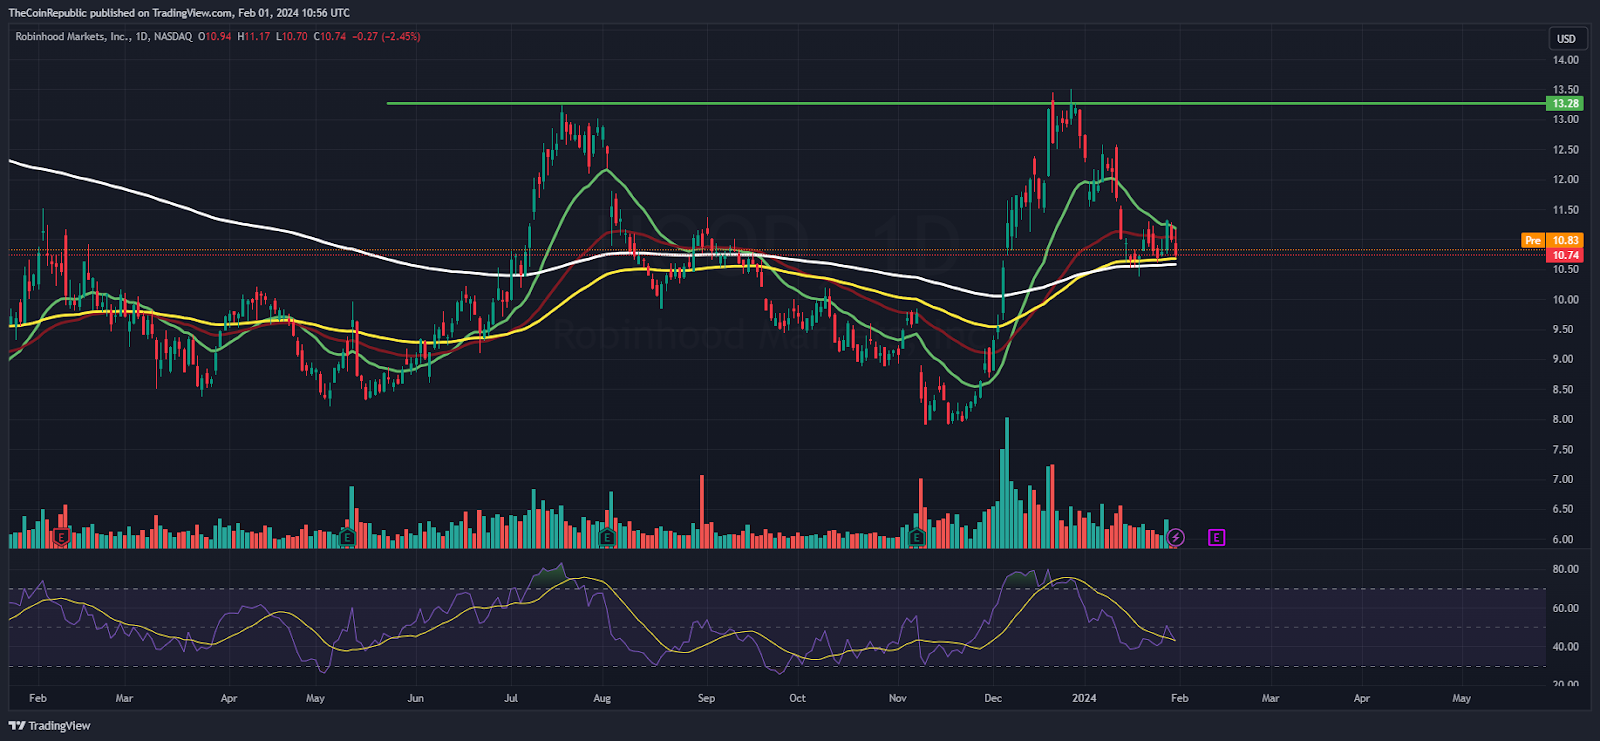
On the daily charts, the HOOD stock delivered a selloff and flipped from the top of $13, revealing selling pressure in the last sessions. Moreover, the stock has formed a double-top pattern, and a correction was witnessed, which might continue to drag the stock below $10 in the following sessions. The technicals are favoring the bears and reveal underperformance in the last sessions. Additionally, the sellers looked strong and were keen on breaching the make-or-break zone of $10.
The RSI curve stayed below the midline, showing a negative divergence and suggesting seller dominance. The MACD indicator shows a bearish crossover, meaning the stock will continue to face correction and retest $9 in the coming sessions.
HOOD on Weekly Charts Delivers Consolidation
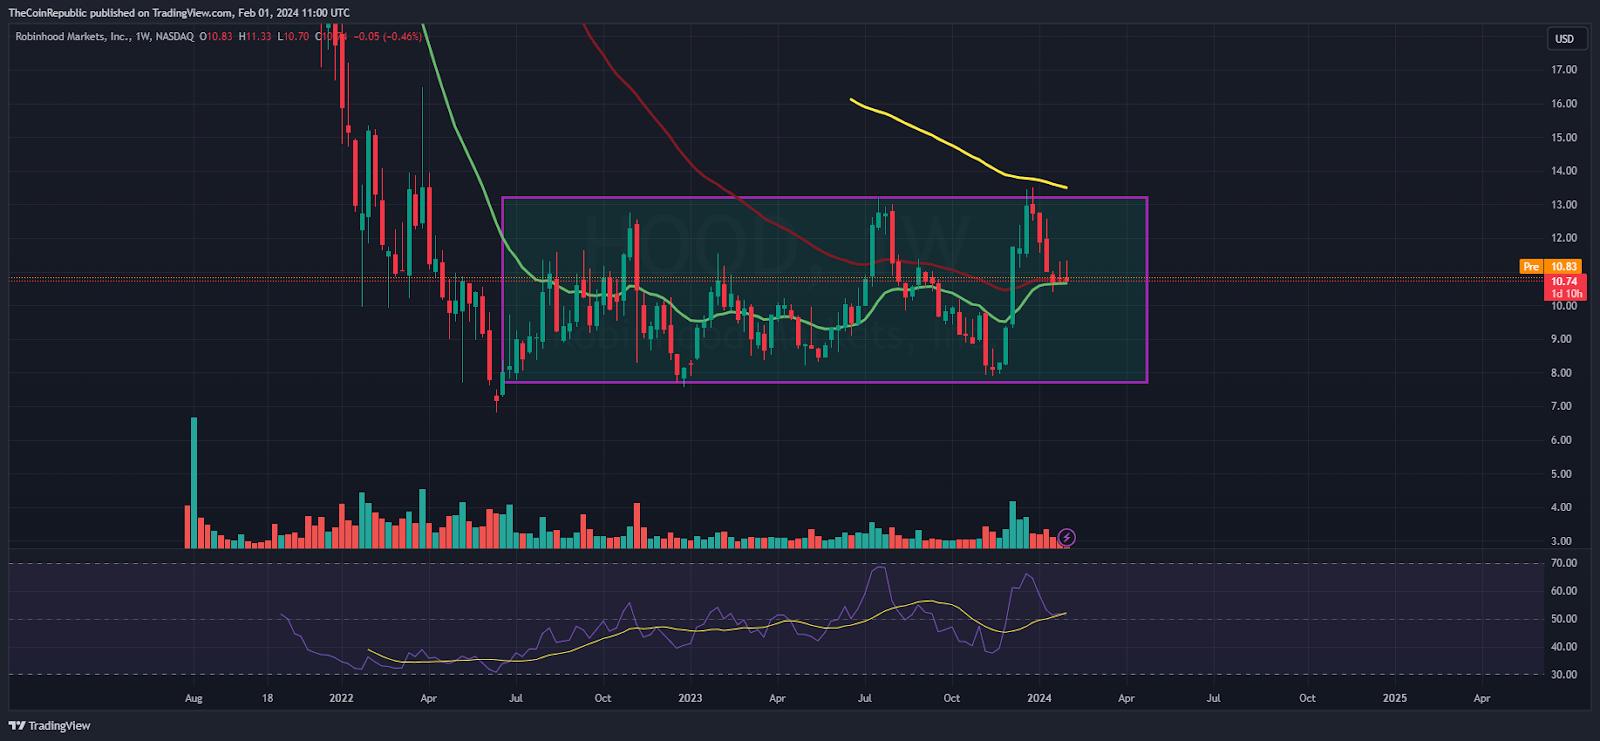
Over the past weeks, HOOD stock has been in a range and faced rejection near the neckline of $13, which was noted in the last sessions. Afterward, a severe push was noted, and stock threw to the 20-day EMA mark. This range-bound move tensed the investors, which reflected the dilemma between the bulls and bears.
Summary
The HOOD stock reflects selling pressure and is close to registering a breakdown below the round mark of $10. The trend is negative and the stock might drag toward $9 in the upcoming sessions. The technical indicators have given a breakdown alert and investors have squared off their positions due to fear.
Technical Levels
Support Levels: $10 and $9.30
Resistance Levels: $11 and $11.70
Disclaimer
The views and opinions stated by the author or any other person named in this article are for informational purposes only and do not constitute financial, investment, or other advice. Investing in or trading crypto or stocks comes with a risk of financial loss.

Amanda Shinoy is one of the few women in the space invested knee-deep in crypto. An advocate for increasing the presence of women in crypto, she is known for her accurate technical analysis and price prediction of cryptocurrencies. Readers are often waiting for her opinion about the next rally. She is a finance expert with an MBA in finance. Quitting a corporate job at a leading financial institution, she now engages herself full-time into financial education for the general public.


