
 Home
Home News
News
- 1 The STX crypto price slid from a key supply level on the chart.
- 2 The STX crypto asset is showing bearish behavior and suggests that it could fall more.
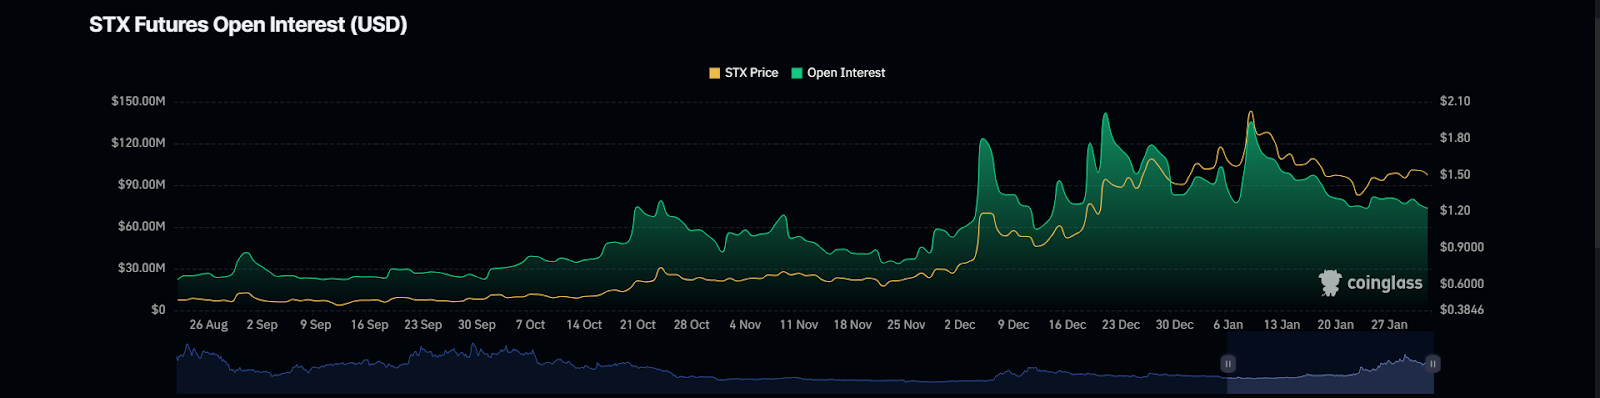
Stacks crypto’s (STX) open interest is $72.20 Million; it plummeted by 2.43% in the previous session.
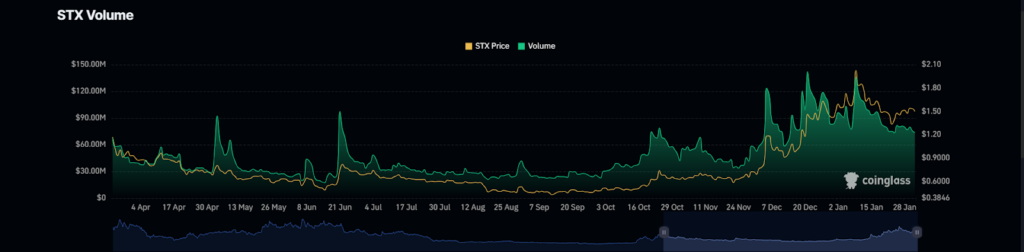
STX volume is $167.50 Million, it rose by 3.29% in the previous session.

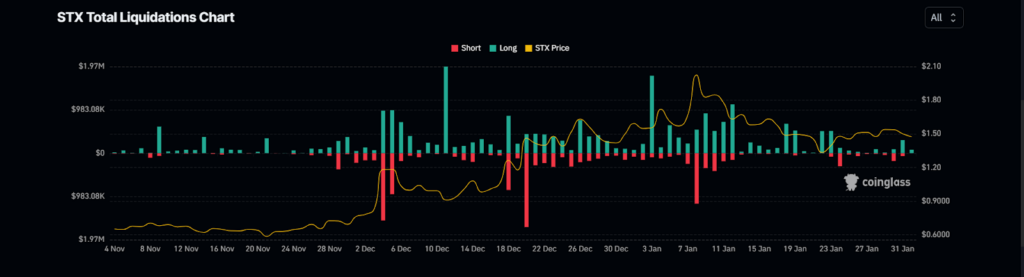
The long versus short ratio for 24 hours is 0.9708. The short liquidation is $64.58K versus $335.04K for the long liquidation.
Stacks Crypto Price Chart In 1-D Time Frame
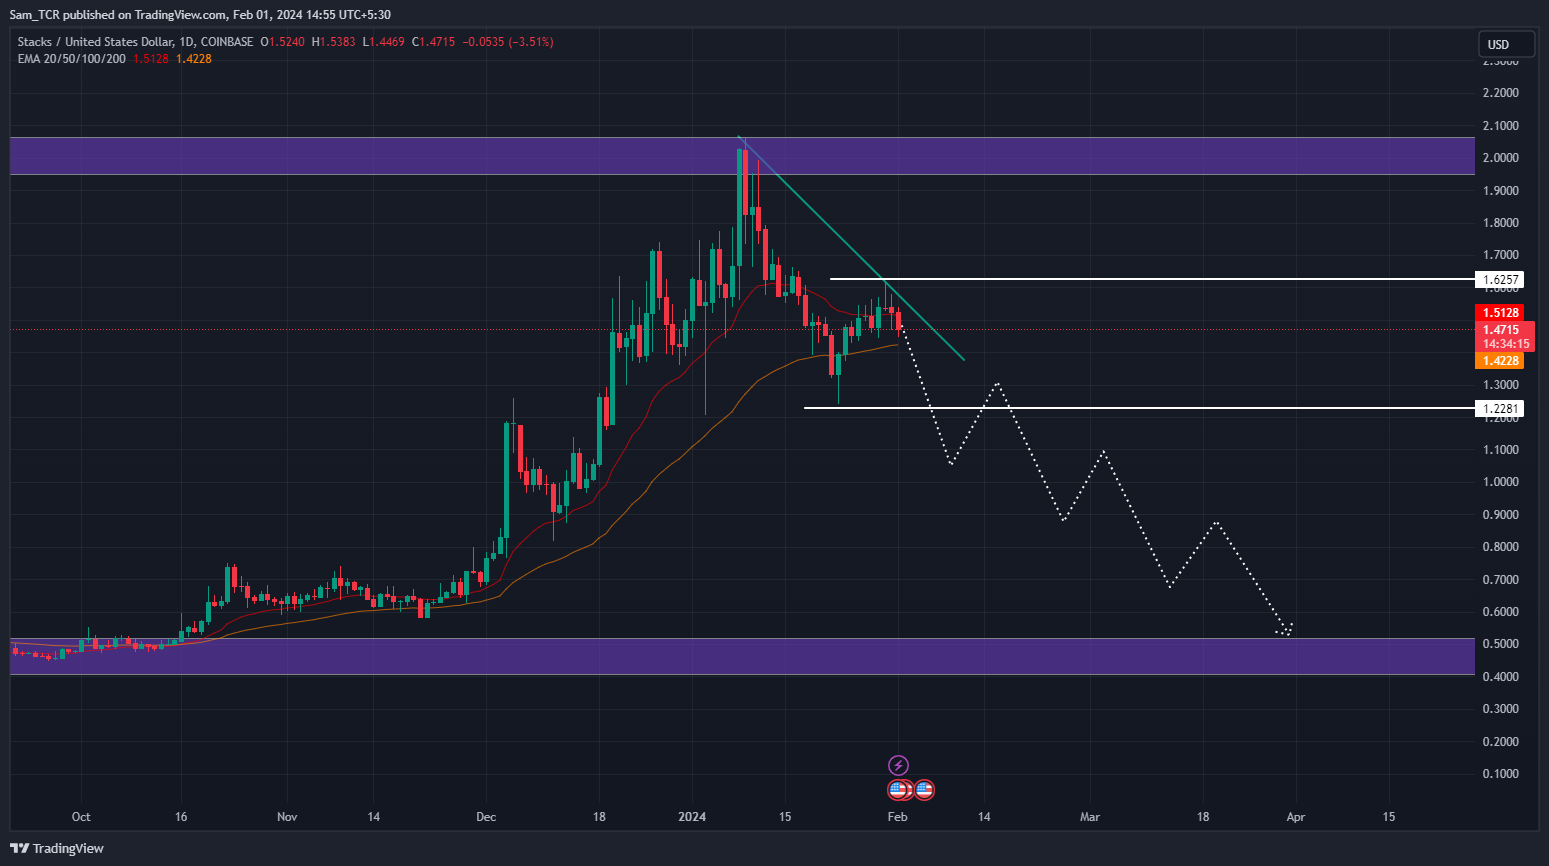
The price action shows that the price was in a strong uptrend before and made higher highs and lows from $0.4000 to $2.0000 in the past.
But the STX crypto showed a sign of fall as the price slid from a supply level of around $2.0000 on the chart. The STX crypto is close to a big drop, as it encountered a resistance level and made lows from the current support zone.
The chart shows a 0.99% drop last week and a 9.91% drop last month, highlighting a steady downtrend.
On top of that, the STX crypto asset is showing bearish behavior and indicates that it has the chance to fall more. Besides, the STX crypto registered a 3.50% drop in the last 24 hours. It is currently trading at $1.4716.
Therefore, if the STX crypto price fails to hold above the $1.2281 level, it could crack the current support and fall more to the next big support.
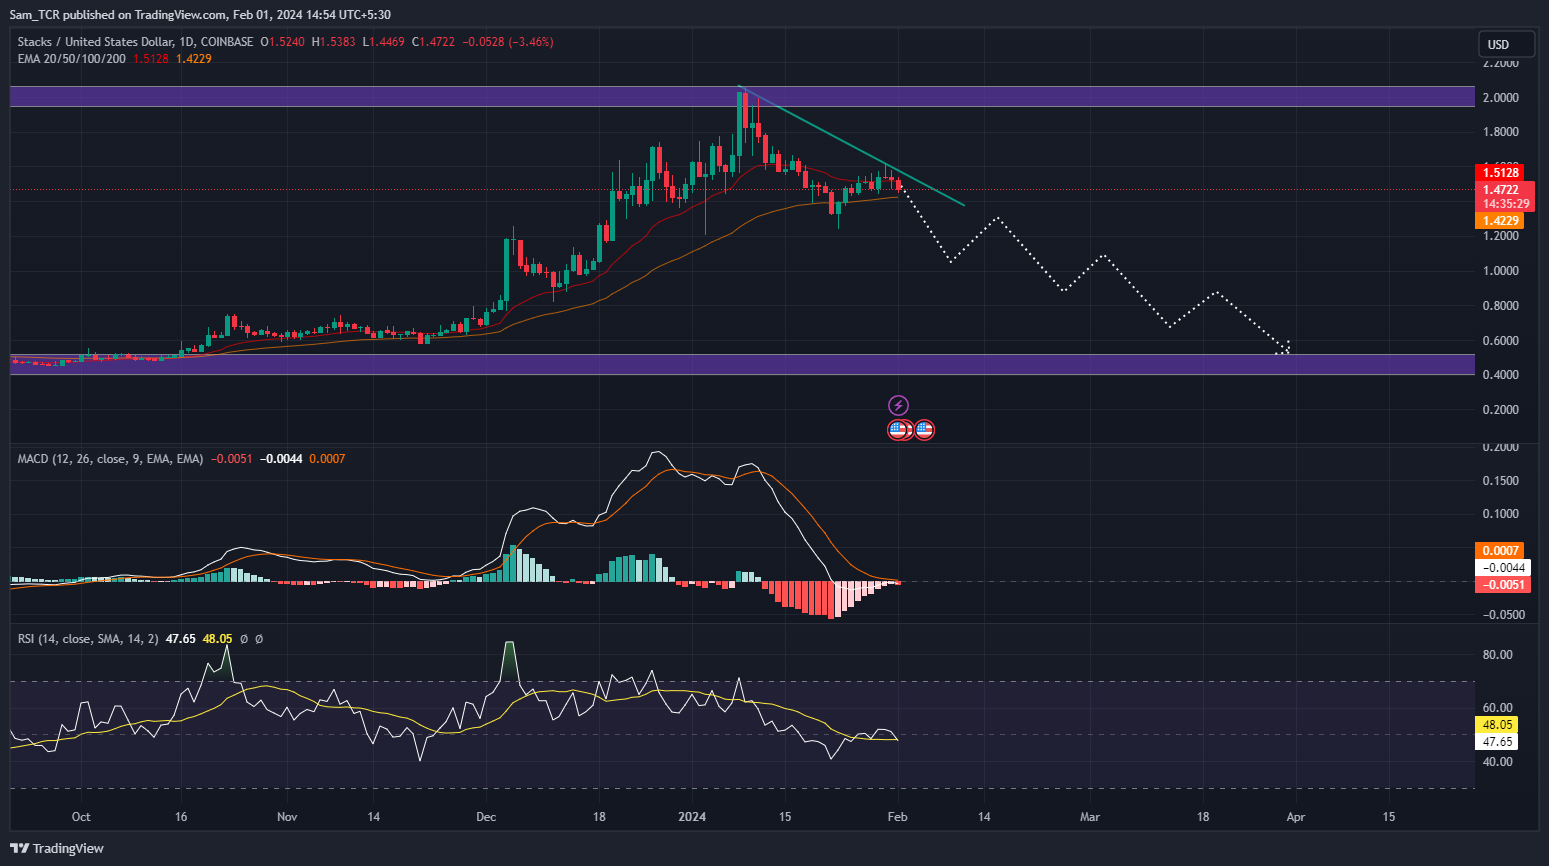
The STX crypto asset is showing bearish features as MACD is at -0.0047 and showing a bearish crossover. Meanwhile, the signal line is at 0.0007 and the histogram difference between both the lines is -0.0054.
Stacks crypto chart shows a downtrend as it drops below the 20-Day EMA and heads toward the 50-Day EMA from above.
The RSI is falling gently by facing resistance from 14-SMA, suggesting that the STX crypto asset is losing speed and can reach new lows. Whereas, RSI is at 47 and 14-SMA smoothened line is at 48.
On the other hand, if the demand for the crypto and buying force increases high, then the STX asset price could reverse from the current level. The next target for the STX price would be to reach $1.6257.
Summary
The STX crypto asset is showing bearish behavior, which is expected to be the case in the coming sessions. Poor performance last week and last month confirm a downtrend. If the STX crypto price fails to hold above $1.2281 level, it could crack the current support and fall to the next big support.
Technical Levels
Support Levels: $1.2281
Resistance Levels: $1.6257
Disclaimer
In this article, the views, and opinions stated by the author, or any people named are for informational purposes only, and they don’t establish the investment, financial, or any other advice. Trading or investing in cryptocurrency assets comes with a risk of financial loss.
Steve Anderson is an Australian crypto enthusiast. He is a specialist in management and trading for over 5 years. Steve has worked as a crypto trader, he loves learning about decentralisation, understanding the true potential of the blockchain.


