
 Home
Home News
News
- 1 The VeChain crypto is bouncing back from the lower levels showcasing bullishness.
- 2 VET crypto’s price has been under bullish dominance from the previous few sessions.
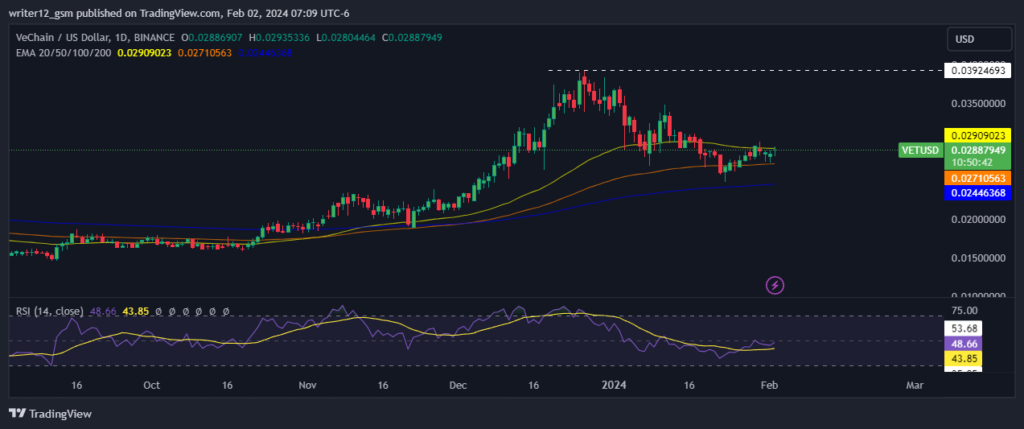
VeChain trying to bounce back from the lower levels. By analyzing the price data of the VET coin, it is observed that it is heading toward upper levels. The price increased by 9.50% in the last seven days and we can say that VeChain performed well last week.
From its peak price of $0.03924693, it fell 80.50% in the last 2 years. However, the current market sentiments are neutral. A respectable volume is noted on VeChain at present. The investors are trying to reach upper levels and dominate sellers.
The price of VeChain (VET) has jumped above 100 and 200 EMAs, which suggests that the price is entering a bullish trend. If the buyers continue to push the price up, the coin’s value may surge even further in the upcoming week.
The price has been consolidating near key EMAs in the previous weeks, which suggests a tough fight between bulls and bears over the price.
Technical Analysis of VeChain Price
The technical indicator MACD is also heading towards positive territory. The MACD line is at -0.00058771 and the signal line at -0.00080038 is above the zero line. That suggests the MACD is heading toward positive territory and is giving bullish signals.
The current value of RSI is 48.63 points. The 14 SMA line is presently near the median line, around 50.16 points, which shows bullish sentiment in the market. The bullish trend is demonstrated by the 14-day SMA curve leading above the median line. As the price is in the overbought territory, the market is displaying bullish sentiments.
The price bounced off of its significant trendline and is moving towards the support level. If the price crosses outside the trendline, it will probably test the following resistance level. Suppose it fails to break above the resistance, it will retrace to the recent support level.
The MACD indicator shows a bullish divergence between the price and the indicator, suggesting a possible reversal of the downtrend. The RSI indicator is around the oversold zone, indicating that the selling force is lagging.
Conclusion
In VeChain (VET), we can see a tough fight between bulls and bears, as the coin is trying to come back. The price action shows that the price may grow more in the upcoming days if the upper resistance level breaks. The VET price shows an optimistic scenario at the moment. Major reliable indicators like EMAs, RSI, and MACD give positive signals about VeChain. Hope is developed among investors because of the good performance of the coin in recent times.
Technical Levels
Support Level: $0.02711415.
Resistance Level: $0.03924693.
Disclaimer
The analysis given in this article is for informational and educational use only. Do not take this information as financial or trading advice. Trading and investing contain financial risk. Before making any investment or trading decision, please consider your risk profile and circumstances.

With a background in journalism, Ritika Sharma has worked with many reputed media firms focusing on general news such as politics and crime. She joined The Coin Republic as a reporter for crypto, and found a great passion for cryptocurrency, Web3, NFTs and other digital assets. She spends a lot of time researching and delving deeper into these concepts around the clock, and is a strong advocate for women in STEM.


