
 Home
Home News
News

- 1 The OP price replicates buyer accumulation and rebound from the 50-day EMA.
- 2 Buyers are looking to escape the $3.50 mark to attain momentum.
The OP price signified bullishness and rebounded from the 20-day EMA mark, replicating buyers’ accumulation on the charts. The price action indicates that buyers have held their strength and continued showcasing their legacy amidst the market volatility. Moreover, the Optimism token is preparing for a pump above the prompt hurdle of $3.30 to skyrocket the gains above $4 in the following sessions.
The OP token price has escaped the key moving averages and is trading in the bullish trajectory, signifying bullishness on the charts. However, the token must surpass $3.50 to glimpse a short-term reversal toward the highs above $4. The price action noted buying momentum from the lows and the token is sustaining gains decisively above the support zone of $3.

The cryptocurrency price was $3.26 at press time with an intraday gain of 6.97%, showing a pullback from the 50-day EMA mark. Moreover, the trading volume increased by 77.85% to $241.38 Million, highlighting buyers’ accumulation. The pair of OP/BTC was noted at 0.0000755 BTC and the market cap is $697.46 Million. Analysts are bullish and suggest that the Optimism crypto will retain bullishness and may skyrocket above $4 soon.
The OP Crypto on Daily Charts Displays Buyers’ Accumulation
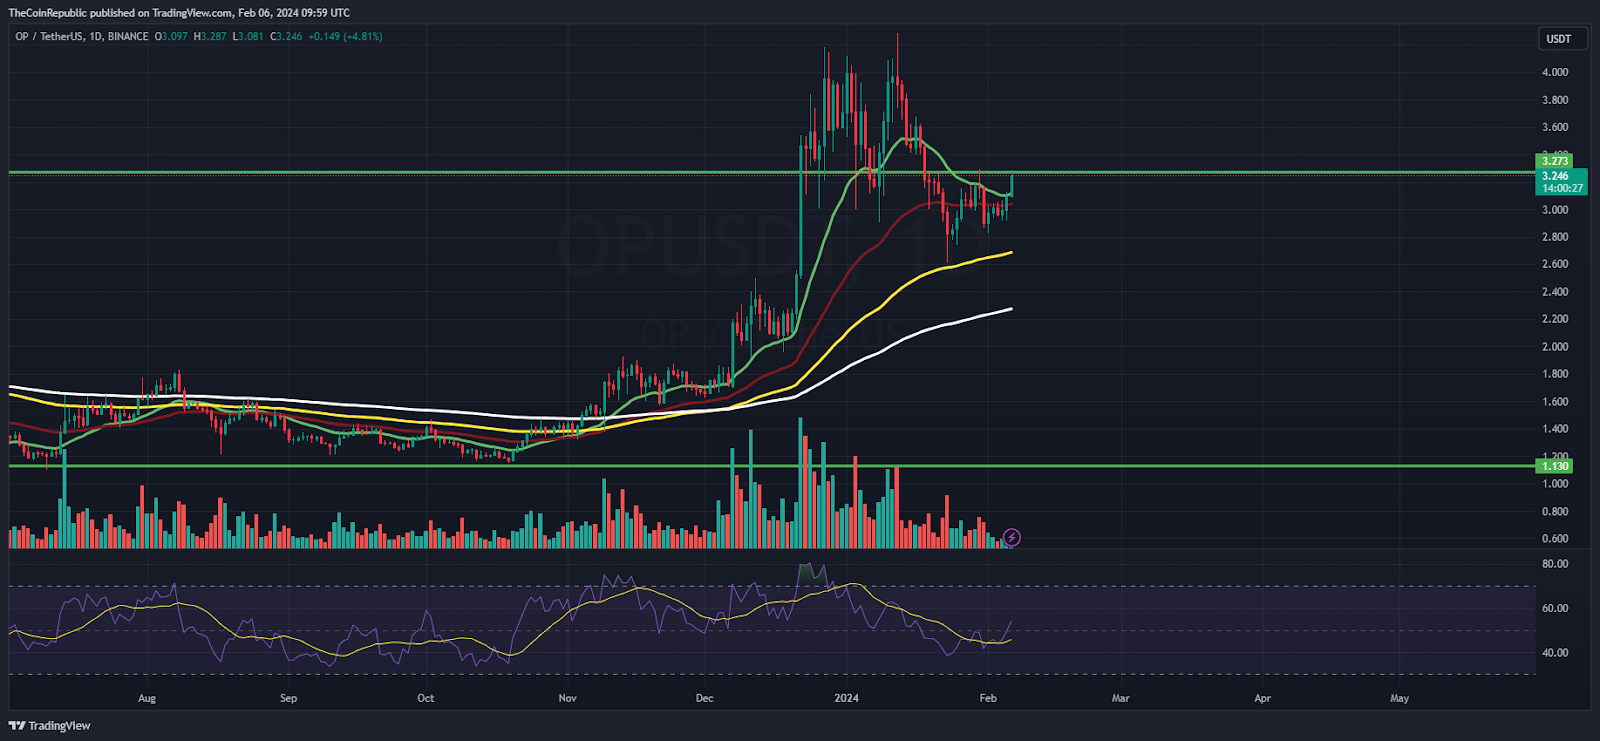
On the daily charts, the OP token price shows a bullish bias and is holding gains decisively above the 20-day EMA mark. It depicts the higher high swings and sustains gains above $3. Furthermore, the trend is strong and a short covering move will soon lead the token price above the critical hurdle of $4. The token has retested the breakout region of $3 and it is above the 38.2% Fib zone.
The RSI curve stays close to 50 in the neutral zone and shows a bullish outlook on the charts. The MACD indicator shows a bullish crossover and the token is ready to uplift the gains in the upcoming sessions.
The OP Price on Weekly Charts Reveals Bulls Dominance
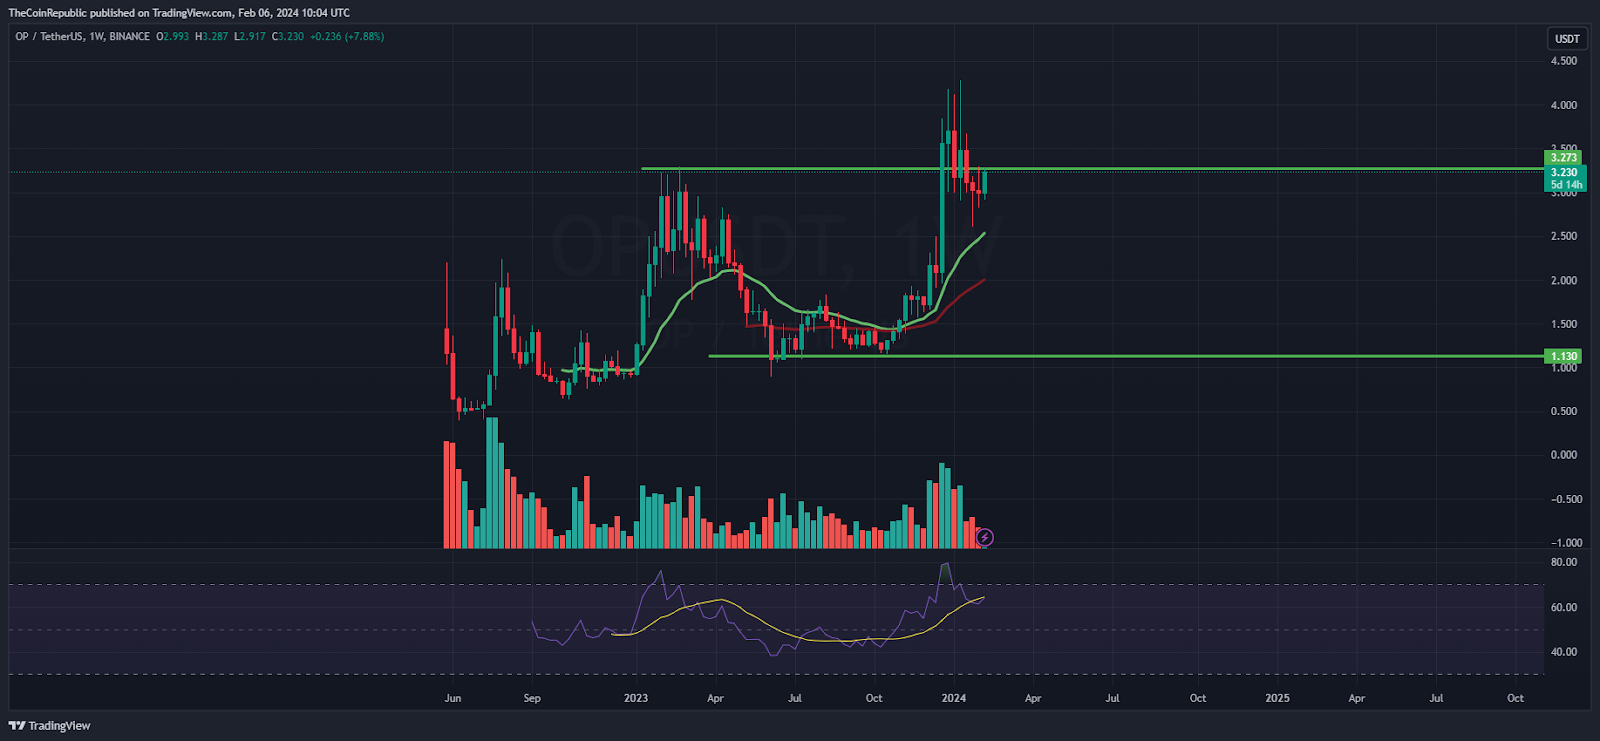
On the weekly charts, the OP crypto signifies bullish momentum and is ready to outperform in the coming weeks based on the price action. The token was in an uptrend and is prepared to surge above $3.50 against the negative market sentiments. Additionally, the token has shown a rebound and is trying to attain a reversal.
Summary
The OP token price depicts an uptrend and has decisively sustained gains above $3 in the bullish trajectory. Moreover, the buyers have persisted in accumulating the token and are trying to retain the gains above $4 in the coming sessions. However, the token must surpass the prompt hurdle of $3.50 to gain strength. If it doesn’t, it will retrace to $2.70 in the following sessions.
Technical Levels
Support Levels: $3.00 and $2.70
Resistance Levels: $3.40 and $4
Disclaimer
The views and opinions stated by the author or any other person named in this article are for informational purposes only and do not constitute financial, investment, or other advice. Investing in or trading crypto or stocks comes with a risk of financial loss.

Steefan George is a crypto and blockchain enthusiast, with a remarkable grasp on market and technology. Having a graduate degree in computer science and an MBA in BFSI, he is an excellent technology writer at The Coin Republic. He is passionate about getting a billion of the human population onto Web3. His principle is to write like “explaining to a 6-year old”, so that a layman can learn the potential of, and get benefitted from this revolutionary technology.


