


The Toncoin price analysis indicates that the TON crypto is currently making efforts to reclaim its position in the bullish zone but failing in its attempts.
To start the recovery, TON needs to attract more buyers. Notably, the price has been entered within this bearish territory since Dec 23, as it recently slipped below it on key moving averages. furthermore, at the present moment, the TON price is striving to re-enter the bullish zone but bears pulling the price down. The key challenge here is building buyer confidence to support this upward momentum.
The Toncoin price had a remarkable rally in the previous months, rising from the $1.27 support zone to the $2.77 high by Nov 2023. However, the TON crypto failed to sustain its position at this higher level and suffered a decline, entering a bearish phase.
According to the trading view, the TON price was at $2.04 and slipped slightly around 0.27% of its market capitalization during the day’s trading session. However, trading volume has risen by 20% during the intraday trading session. It shows that sellers are trying to drag the price down from the neckline. The volume to market cap ratio was 0.35%.
Will the Toncoin Price Show Any Directional Change?
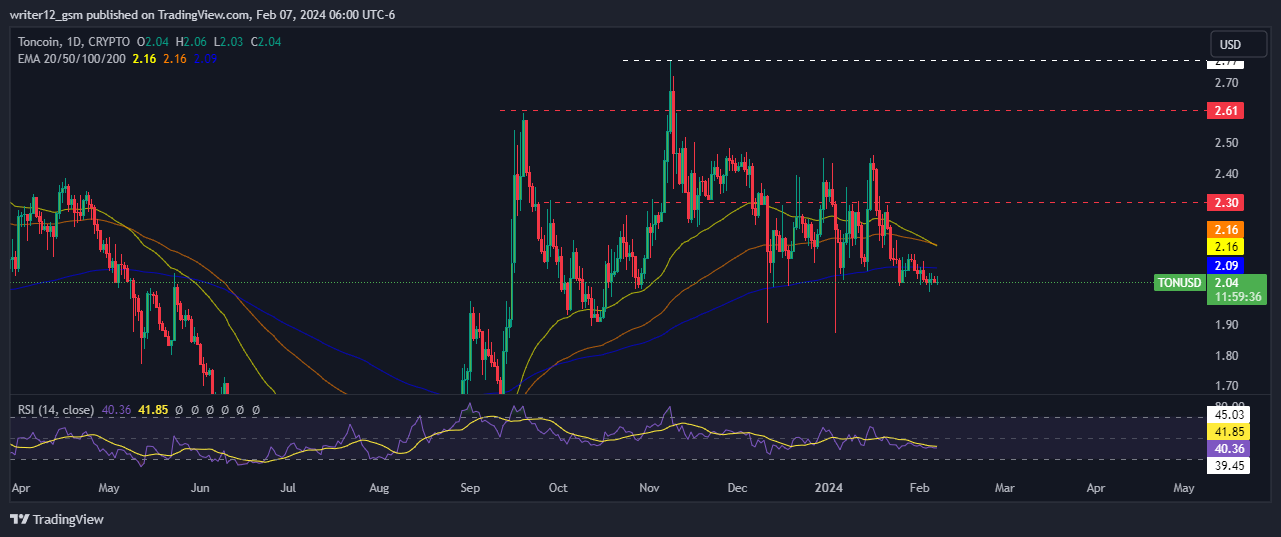
The Toncoin price analysis suggests a significant increase in selling momentum, indicating a bearish phase seen on the daily chart. Moreover, it’s important to note that the cryptocurrency currently sits below the 20, 50, 100, and 200-day daily moving averages. Nevertheless, there’s a noticeable drop in trading volume. Ideally, we would expect to see a rise in trading activity in upcoming sessions.
For the Toncoin crypto price to break out of its bearish phase and reach the recovery level, it needs to attract potential buyers. Notably, TON crypto has seen a 1.44% decrease in the past week and a significant loss of 6.96% in the last month.
Over the last three months, Toncoin has witnessed a decline of 23.28% and within the last six months, it has gained by 62.96%. It highlights the challenges the cryptocurrency has faced in its journey to recover throughout the year.
Technical indicators suggest the struggle of TON cryptocurrency at the lower trendline. The relative strength index shows the bearishness of the TON crypto at the current level. Moving average convergence divergence shows the downside trend of the TON price.
Summary
TON cryptocurrency analysis suggests bearishness in the crypto price. The key indicators like MACD, RSI, and EMAS also support the bearish trend on the on-day time frame chart. The bears are dominating the price from the higher levels and are not in the mood to shift the power over the trend.
Technical Levels
Support Levels: $1.90 and $1.60.
Resistance Levels: $2.61 and $2.30.


