
 Home
Home News
News

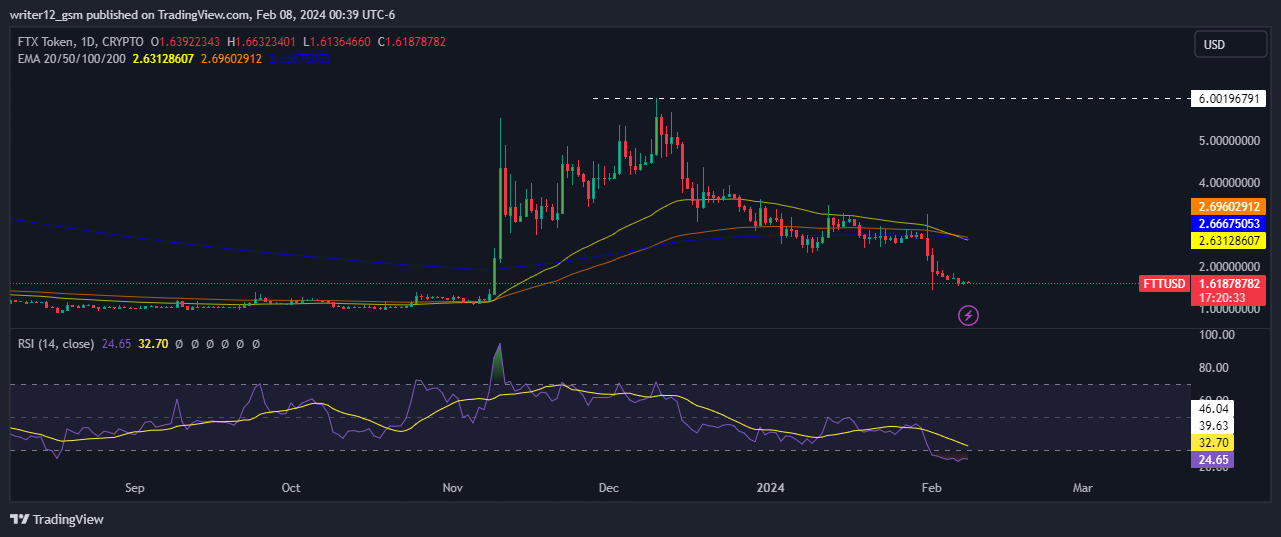
- 1 FTT Token price forecast demonstrates the downside of the price on the daily timeframe.
- 2 The FTX token price broke below the key moving averages, showcasing bearishness on the daily chart.
- 3 Bears are looking aggressive in previous trading sessions and dominating bulls.
The FTT crypto price is facing strong bearish pressure on the daily frame technical charts, as it is trading below the 50, 100, and 200-day EMAs. The crypto has failed to break above its prominent resistance levels near the $6 level in the past few months, despite several attempts by bulls.

The company’s performance could have been better throughout the year. It has bore negative returns of 47.32% in the year-to-date period, gained by 40.89% in the last six months, down by 39.28% in the last month, and 29.44% in the last week. That shows a long bearish trend that continued till now.
FTT price forecast suggests that the crypto is in the firm grip of the sellers and needs to show some signals of rebound before confirming a bearish trend.
The technical indicators favor the sellers projecting a negative perspective for the buyers on the technical chart. The RSI and other oscillators are moving close to the negative zone whereas the major EMA lines act as obstacles for the FTX price.
At press time trading near $1.61470764, with a marginal loss of 1.49% in the intraday session. The crypto has a potential upside target of $6.00, but it needs to overcome the bearish momentum and surge above the key EMAs. The crypto has a support level of $1.00, which could prevent the price from further downside moves.
Technical Evaluation of FTT Crypto Price in 1-D Timeframe
The FTT crypto (USD: FTX) is trading under the 50 and 200-day EMAs (exponential moving averages), which do not support the price trend. The price is trading close to the lower Bollinger band, showcasing bearishness at 1.34847011.
The MACD line at -0.35498760 and the signal line at -0.28898932 are below the zero line. A bearish crossover is noted in the MACD indicator which signals more bearishness for the FTX cryptocurrency.
The current value of the RSI curve is 32.70 points. The 14 SMA is above the median line at 24.57 points which indicates that the FTT crypto is bearish.
Summary
FTT (USD: FTX) technical analysis reveals that the sellers have been dominant on the daily technical chart. Technical indicators also confirm the bearish sentiment in the market, as the RSI is near the oversold zone at 32 and the MACD has formed red bars and a bearish crossover. The crypto has been on a downward trend, as it has broken below the key EMAs. These signals indicate that the crypto may face more downside pressure in the upcoming days.
Technical Levels
Support Level: The FTT crypto price may find support at $1.13 where it could bounce back or stabilize.
Resistance levels: The FTX crypto price may face resistance at $2.631, where it could reverse or consolidate.
Disclaimer
This article is for informational purposes only and does not provide any financial, investment, or other advice. The author or any people mentioned in this article are not responsible for any financial loss that may occur from investing in or trading. Please do your own research before making any financial decisions.

Adarsh Singh is a true connoisseur of Defi and Blockchain technologies, who left his job at a “Big 4” multinational finance firm to pursue crypto and NFT trading full-time. He has a strong background in finance, with MBA from a prestigious B-school. He delves deep into these innovative fields, unraveling their intricacies. Uncovering hidden gems, be it coins, tokens or NFTs, is his expertise. NFTs drive deep interest for him, and his creative analysis of NFTs opens up engaging narratives. He strives to bring decentralized digital assets accessible to the masses.


