
 Home
Home News
News
- 1 The stock showcased a double bottom formation near $3 and is holding gains.
- 2 Buyers are looking to retest the 20-day EMA and are anticipating a bounce.
The HIVE stock (NASDAQ: HIVE) has stopped correction near $3 and made a double bottom pattern, which signals a short-term reversal in the following sessions. Investors are awaiting a confirmation that strikes if the stock escapes above $3.25, which leads to a bounce toward $3.60. Furthermore, the price action showcased a reversal pattern and bulls anticipate a pullback.
The stock has slipped to the bearish region below its key moving averages, replicating a downtrend on the charts. Moreover, the stock has witnessed a volatile move, and roller coaster moves were seen in the past sessions. Recently, a bounceback was noted from the low of $2 to the high of $5.50. However, sharp profit booking spoiled the investors’ dreams and reverted their portfolio from green to red.
At Wednesday’s close, the HIVE stock was at $3.11, with an intraday gain of 1.30%, showing neutrality in the last session. The trading volume is 1.57 Million and the market cap is $272.53 Million. Analysts are neutral and suggest a hold rating with a yearly target price of $6.17. The technicals are delivering a sell outlook and have a negative return ratio. The monthly return was (-26.30%) and (14.33%) on a yearly basis, reflecting underperformance for the past weeks.
HIVE on Daily Charts Displays Downtrend
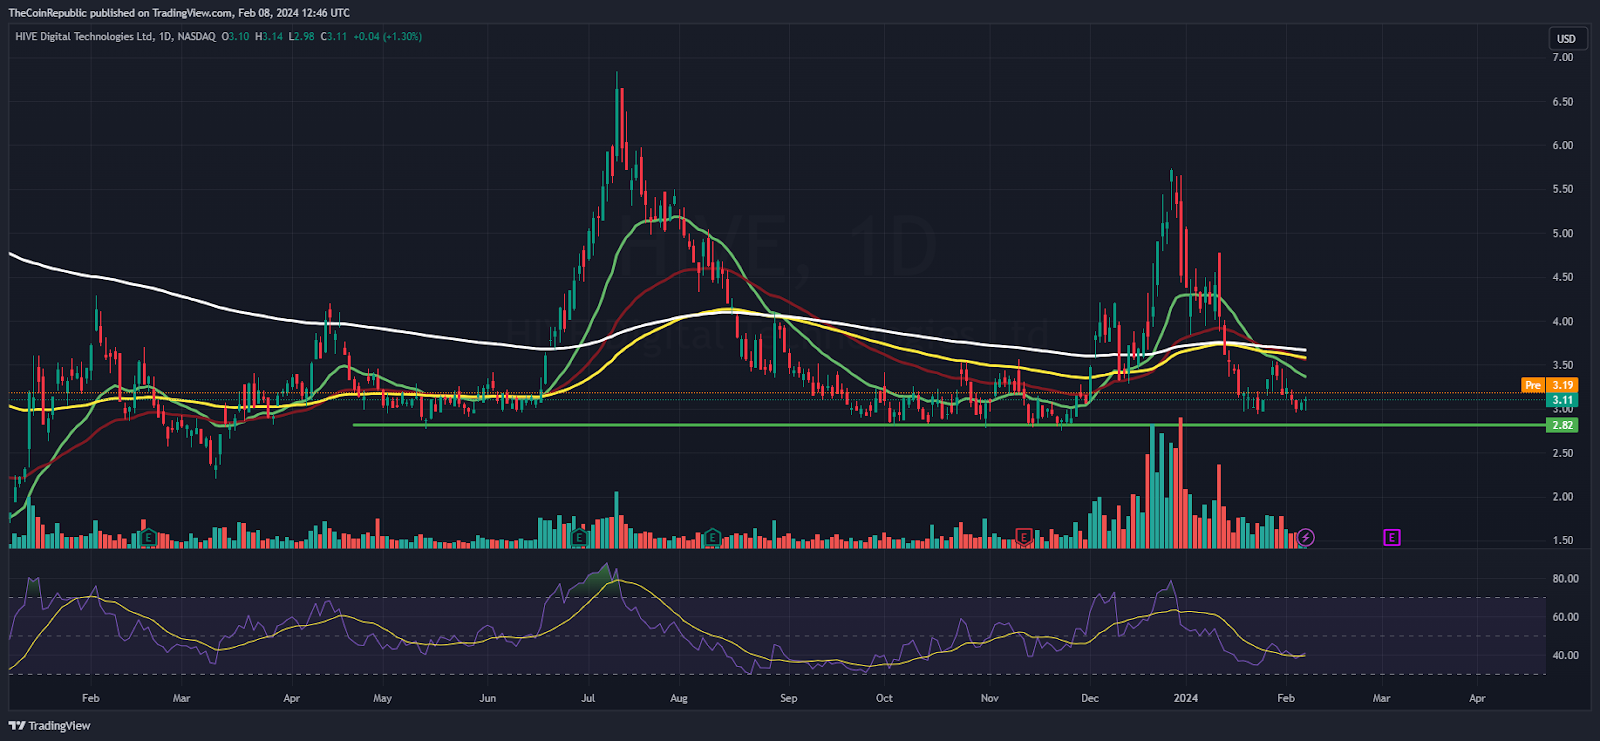
On the daily charts, the stock has witnessed a sharp rejection near the 50% Fibonacci retracement level of $5.50 and lost over 40% of gains in the last sessions. However, a rounding bottom formation was witnessed, but a fakeout led to bulls being trapped, and sellers took advantage of it.
The Relative Strength Index (RSI) curve stays in the oversold region and delivers a neutral view. The MACD indicator shows a bearish crossover and will likely initiate a bullish crossover in the following sessions.
HIVE on Weekly Charts Reflects a Rejection from the 100-Day EMA

On the weekly charts, the stock price retested the 100-day EMA mark, witnessed a sharp rejection, and switched to the lows. Moreover, the weak trend favors the bears, indicating the downside risk to $2.70 in the coming sessions. If bulls hold the $3 mark, a short covering move will trigger. That may reflect a healthy comeback soon.
Summary
The HIVE stock (NASDAQ: HIVE) price hovers near the demand zone of $3 and is revealing bearishness on the charts. Moreover, the stock is awaiting a pullback to the 20-day EMA mark and is exhibiting a double-bottom formation near the lows of $3. Additionally, the RSI curve marked 30 signals an oversold status, hinting that a pullback may arise soon.
Technical Levels
Support Levels: $2.70 and $2.50
Resistance Levels:3.40 and $3.60
Disclaimer
The views and opinions stated by the author or any other person named in this article are for informational purposes only and do not constitute financial, investment, or other advice. Investing in or trading crypto or stocks comes with a risk of financial loss.

Steefan George is a crypto and blockchain enthusiast, with a remarkable grasp on market and technology. Having a graduate degree in computer science and an MBA in BFSI, he is an excellent technology writer at The Coin Republic. He is passionate about getting a billion of the human population onto Web3. His principle is to write like “explaining to a 6-year old”, so that a layman can learn the potential of, and get benefitted from this revolutionary technology.


